One of the impacts has been volatility in crude oil prices, which have seen wild gyrations due to a supply/demand imbalance. There is huge uncertainty around the future trend with wildcards including whether other countries follow the US in banning Russian energy imports, and whether Opec countries choose to ramp up production.
But even with the current stress in the system, gas prices have surged by 49.2% to $4.325 per gallon, vs. March 2021 at $2.898/gallon.
In our last piece on personal auto, we discussed the impact of Omicron on driving trends. Some companies did note in their Q4 commentary that Omicron-related driving reduction modestly helped loss cost trends. However, the recent CPI data indicates a continued uptick in overall trends, which have worsened due to a combination of rising severity, changing driving patterns, and chip and vehicle shortage, as well as regulatory pressures on allowing rate changes.
However, if gas prices continue to rise, could there be a collateral benefit to the personal auto space? Or – with talk of a possible oil shock-driven recession picking up – is unemployment likely to emerge as the more significant driver impacting loss cost trends?
On Thursday March 17, Allstate will be hosting one of its first special topics call, so these topics will likely figure on this call.
Our note below looks at the correlation between unemployment, miles driven, and gas prices over time, including different recessions. If gas price increases intersect with a worsening employment situation, personal auto loss trends could receive an under-appreciated benefit.
Firstly, the much stronger inverse correlation is between unemployment and miles driven, than gas prices and miles driven.
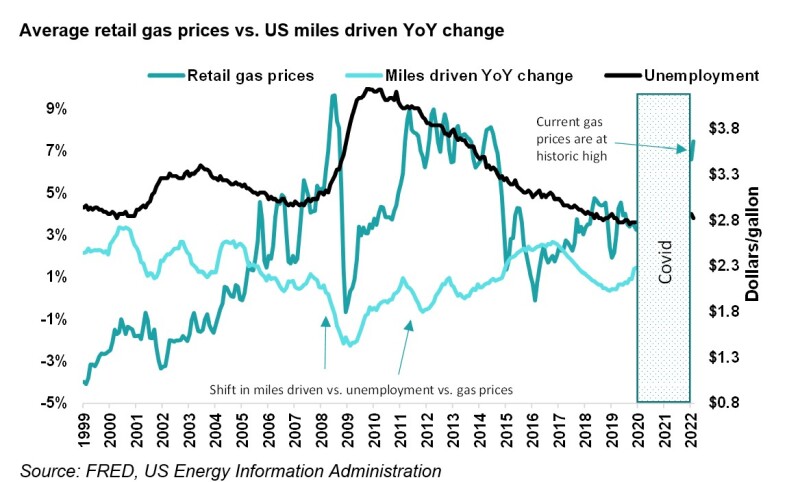
The chart below shows the interaction of the three items. Although miles driven and gas prices might appear closely correlated at first glance, a shift in unemployment was in fact the more significant driver.
This correlation was evident during 2008 when gas prices hit close to $4.00 per gallon, and unemployment rose, fueled by the mortgage crisis. However, there are other periods, including 2014/2015, where gas prices remained high, but a stable employment scenario resulted in miles-driven increases.
Recent employment data from the BLS has continued to indicate a strong recovery, with the unemployment rate at 3.8% vs. a December 2019 rate of 3.5%. With America continuing to emerge from a Covid-enforced lockdown, driving could continue to rebound even as gas prices increase.
The chart below shows that the inverse correlation between miles driven and gas prices stands at only 13%, while miles driven and unemployment was at 42% – three times as strong a correlation!
Secondly, historical loss trends for personal auto do correlate with miles driven.
The $64,000 question in the broader marketplace remains – does a change in miles driven impact loss cost trends.
First, a basic primer on loss cost trends. Loss costs = frequency (number of accidents) * severity (average claim payment).
These can be divided into several coverage types, but the biggest focus areas are mandatory coverage, including bodily injury and property damage liability. Both frequency and severity have to decline for a meaningful impact on loss costs.
Frequency will predominantly correlate with driving and miles driven, while severity will correlate with medical care, wage and cost to repair/replace vehicles.
Armed with that background, we examined Allstate’s claims frequency for bodily injury and property damage. We selected Allstate due to data availability and as an industry proxy. As such, our exercise below is not to prove that Allstate will benefit more than others. However, similar takeaways likely exist for other personal auto-predominant companies.
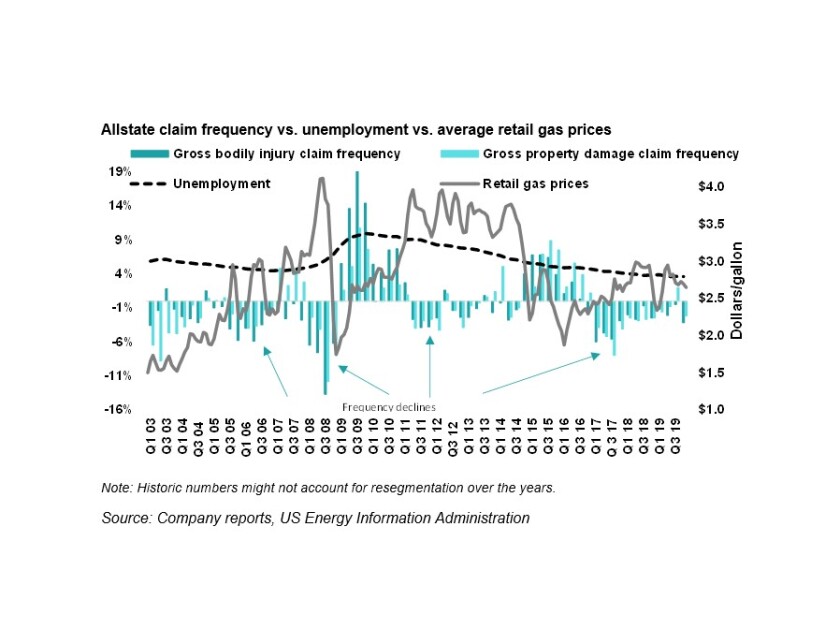
The data below shows that longer term loss cost trends are more closely related to broader employment and gas prices. This dynamic shows that driving to a certain degree is inelastic. A majority of the driving in the US is to and from work. If the economy continues to rebound and “work from home” continues to decline, miles driven will also continue to rise.
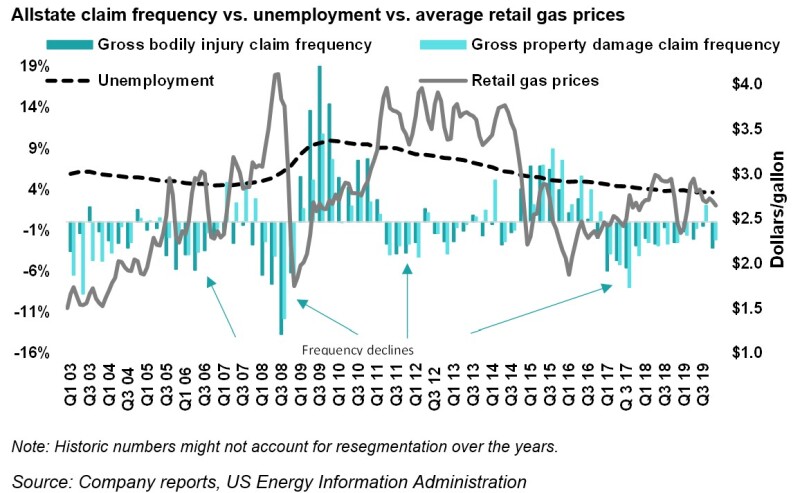
Note the multiple periods above when unemployment appears to be the more significant driver for loss costs to decline even when faced with a rising or stable gas price scenario.
We also looked at state-specific trends in unemployment and the top providers in those states. If unemployment rises in conjunction with a broad economic slowdown, carriers that are larger writers in these states could benefit from a potential reduction in miles driven over time. That said, it is too early to make that call, and we will revisit the below analysis periodically vs. unemployment rates over 2022.
Top personal auto carriers and unemployment by state

Source: S&P Global, FRED
Thirdly, broader economic pressures, including leasing/financing trends, is still an unknown factor.
Apart from the impact of unemployment and miles driven discussed above, the demand equation is another factor to keep in mind.
A robust economy and changing driving patterns have led to an unprecedented demand for vehicles.
Covid-driven delays in supply chains further complicated this issue. Both necessary chips and electronic components and auto replacement parts are facing shortages.
Despite this, demand hasn’t cooled down, as shown in our last note. However, a trifecta of factors could change this. These include the Ukraine war and further stretching of supply lines; rising interest rates; and a lack of clarity on the economy's direction.
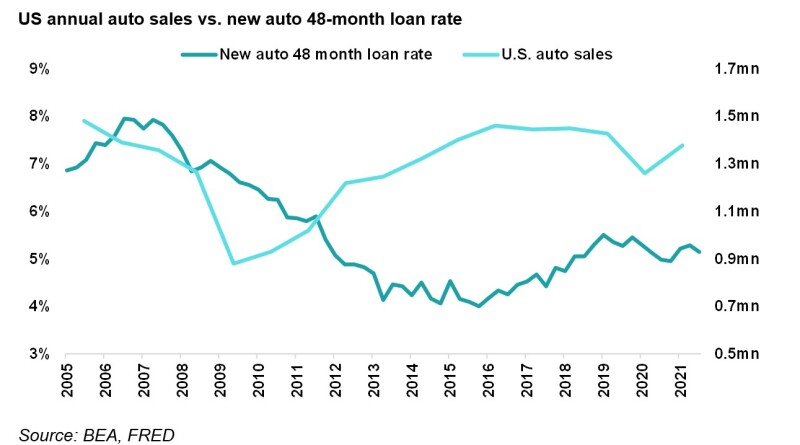
The chart below shows the drop in car sales during the 2020 pandemic, followed by the rebound in sales in 2021. Car sales were lower in 2021 relative to 2019 due to the lack of new car supply.
With most vehicles being leased or financed, a lower interest rate has benefited auto ownership. However, if interest rates rise meaningfully, there could be a slowdown in demand which will have an impact on the rise in used car/vehicle prices.
This potential slowdown could also relieve some pressure on auto insurers who grapple with replacing vehicles that now cost materially more and continue to rise vs. prior estimates. Auto insurers are trying to raise rates, but there is a lag effect, so cooling down in demand would have a quicker impact on loss cost trends.
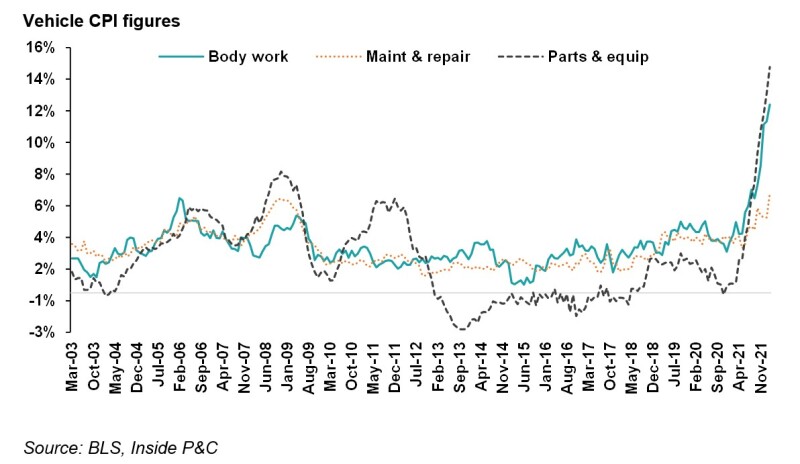
Fourthly, vehicle inflation continued to worsen in February, and is at its highest level since 1980.
Worsening severity in vehicle-related inflationary measures has become the norm as the economic recovery continues.
Drivers returning to roads have not adjusted their pandemic-era unsafe driving habits. Traffic deaths in the first half of 2021 rose faster than any other six-month period since the Federal Transportation Department first published crash death statistics in 1975.
Vehicle CPI figures rose to 10.8% in February, up from 9.4% last month and the highest in 40 years. The result was led by parts and equipment, and bodywork, which have been stressed by supply chain issues, at 14.3% and 11.9%, respectively. Parts & equipment inflation rose from 12.6% in January and remains higher than at any point since before the year 1980.
Maintenance and repair inflation was reported as 6.3%, an increase from the 4.8% figure from last month, and remains higher than any point since the 2008 financial crisis.
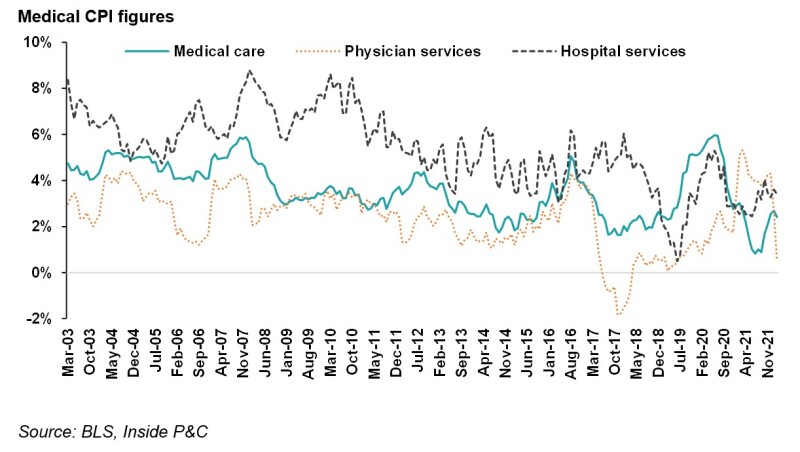
Compared with still-rising vehicle CPI, medical inflation figures are at more normal levels. Medical CPI continues to trail vehicle CPI at 2.1%, lower than January’s figure of 3%.
Average medical inflation has fallen behind vehicle-related inflation since May of 2021, a reversal of the year and a half since January 2020, when medical-related inflation had outpaced vehicle inflation due to the pandemic. Hospital services and medical care led the medical CPI result at 3.4% and 2.4%, respectively. Physician services CPI fell to a low of 0.5%, down from 2.6% in January.
Taking a step back, what this means is that the present trajectory could continue to stress loss cost trends.
Summary: Although it may seem intuitive that rising gas prices will immediately impact loss cost trends, historical analysis shows that unemployment and broader economic conditions are a more significant driver of miles driven.
It is still early to discern the direction of the economy with any confidence. Still, if the Ukraine invasion spreads and impacts the economic outlook in the US, personal auto carriers might see a reprieve in loss cost trends.
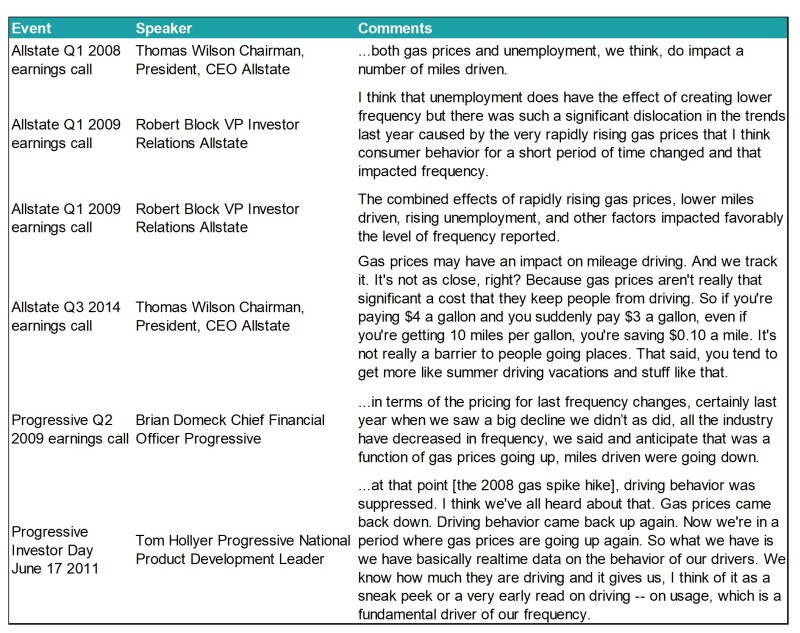
Appendix showing sample comments on gas and unemployment when insurers witnessed swings in loss cost trends
