In some cases, this was the first time since the pandemic-induced caution so it could be said that the sentiment was pretty positive as we swapped stories and reminisced. For fans of football (soccer?), the ongoing FIFA World Cup games added to the merriment.
As the long weekend ended, news emerged from China of protests against the zero-Covid lockdown. It's “déjà vu all over again”, as Yogi Berra said in 1961. After this, discussions turned to broader economic expectations and the Fed’s posture.
Yesterday, Federal Reserve Bank of St Louis president James Bullard offered some thoughts on interest rate expectations.
These events weighed on the overall sentiment regarding how 2023 will unfurl.
Speaking of sentiment shifts, the US P&C insurance industry sentiment, on an overall basis as well on a segmental basis, has moved materially vs. where it was a year ago.
The recently concluded earnings season showed that while some sectors were likely to benefit post-Hurricane Ian, others were still grappling with evolving loss costs. And not all earnings calls were of the same tone. Some companies were in “mea culpa” mode while others were mounting a defiant last stand.
Machine-learning-based sentiment scores
This note aims to organize and present the sentiment from Q3 earnings calls. It uses sentiment scores from S&P Capital IQ, and we present them along with our own insights into the companies.
Although there are many machine-learning sentiment methodologies, the main one commented upon in this note is the “net positivity” score. Per S&P’s site: “This score is based on the ratio of positive to negative words from the Loughran & McDonald’s Sentiment Word Lists, which is then compared with the total number of words. Most scores fall between -5% and 5% with higher scores considered favorable.”
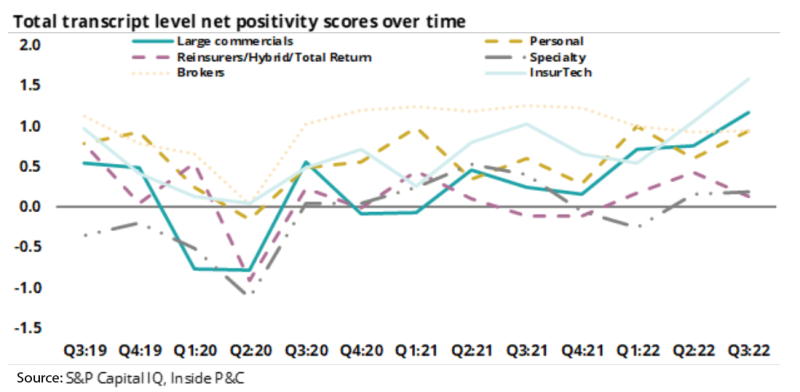
In analyzing sentiment from third-quarter calls, we see that S&P’s “net positivity” score is rebounding across the industry. However, this metric needs to be scrutinized. This is to say, sentiment can be disconnected from performance.
For example, reinsurers seem to have a strong outlook, but by this metric the tone of their calls was the lowest in the industry. On the flipside, InsurTechs are under extreme pressure, but the net positivity of their calls was the highest.
The chart below shows the net positivity scores from quarterly earnings calls for the past three years.

As we see in the chart above, sentiment is well above Covid lows, but still looks depressed for the most part. A couple of exceptions are the brokers, InsurTechs, and large commercials. Based on our analysis of these sectors, the sentiment levels for brokers and large commercials are warranted, but not so much with InsurTechs.
Numeric transparency score exposes the InsurTechs
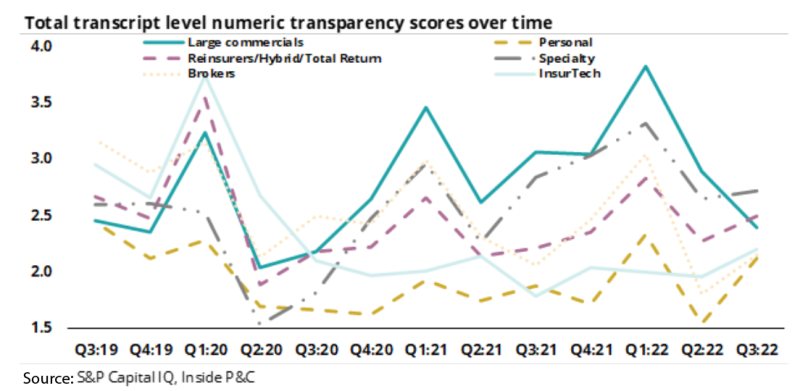
Another notable aspect of sentiment from S&P Capital IQ is the “numeric transparency score” as shown below. This score simply calculates the ratio of numbers to words. It is interesting that commercial lines carriers have the largest variability for this metric.

Shown above, we see that the entire P&C industry mostly moves together, except for the InsurTechs. Intuitively, this makes sense. The InsurTechs tend to present open-ended language in their earnings calls, without the numbers to back it up.
That said, InsurTechs are in the growth phase, so they need to elaborate more to explain their operations vs. mature established players.
Executive net positivity breaks slightly with overall net positivity
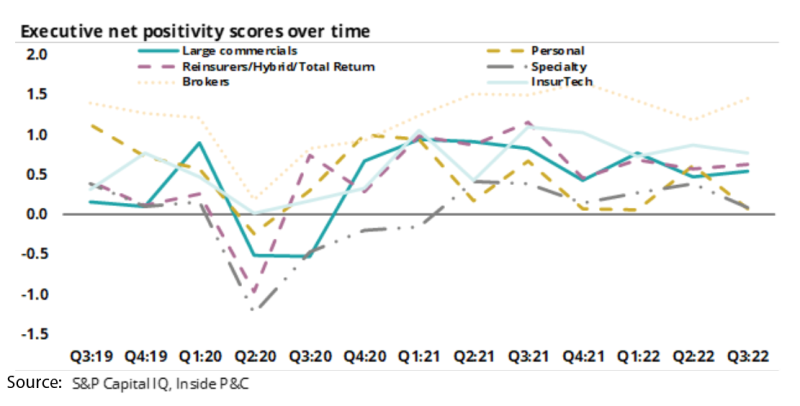
The chart below shows the net positivity score but only taking into consideration words spoken by executives.

As can be seen, this is fairly consistent with the overall net positivity score, which makes sense as executives dominate earnings calls. However, some notable differences should be highlighted. Executives seem more optimistic at the brokers and the reinsurers. Conversely, executives at the InsurTechs, large commercials, and specialty carriers seem less optimistic than the overall sentiment scores.
Below, we provide brief summaries of each P&C insurance sector:
Commercial lines carriers have seen a generally increasing trend in sentiment since Q2 2020
Commercial lines pricing is responding well to the hardening markets, being able to justify rate increases due to Ian, inflation, and higher reinsurance costs. The combination of higher rates and decreasing loss ratios seems in line with the two-year high in sentiment scores.
InsurTechs have the most positive sentiment
According to the overall sentiment metric, InsurTechs have the most positive language from Q3 earnings calls.
The disparity between sentiment and performance could be attributed to the management at InsurTechs insisting on upholding narratives that led to their high valuations in the first place.
Brokers are the second-most optimistic group
The brokers have been in a so-called “supercycle”, and their sentiment seems to match. They’ve been the recipients of higher pricing and exposure growth, but their organic growth and margins, while high, seem to be decelerating quarter over quarter.
Personal lines carriers remain the most negative
Personal lines carriers are still in the midst of worse-than-expected loss costs, and the sentiment from their calls has been bogged down by the increased severity. Tort inflation is also a headwind.
However, the future for personal lines (especially auto) carriers should be better, given a potential peak in inflation, the fall in used car prices, and more aggressive rate filings that will see higher rates earn in over the medium term.
Another positive development for personal auto carriers is the regulatory environment in California, which began approving rate filings after a long hiatus.
Reinsurers see the biggest positive change from last quarter
A number of encouraging factors are elevating the sentiment for reinsurers: an expectation of higher rates, manageable losses from Ian and short-covering on reinsurance names that are all contributing to one-month stock returns of 33.67%, 19.8%, and 16.9% for RenRe (RNR), Arch (ACGL), and Everest Re (RE), respectively.
And yet more positivity was apparent in comments made at Insurance Insider’s London Market Conference last week.
Earnings estimates reflect some of this fault line
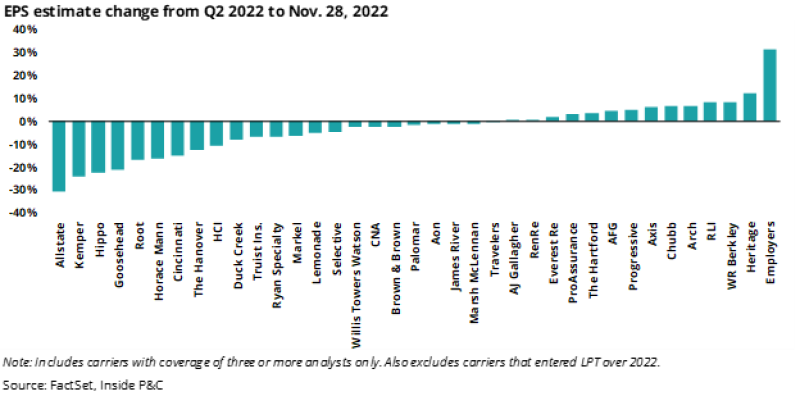
We thought it would be interesting to see the direction of consensus earnings movement over the same period. Overall, we see a familiar fault line. Companies with personal lines (auto) exposure have trended down, while specialty names have trended up.


