This past Friday was an important day when considering the economic outlook. The latest Bureau of Labor Statistics numbers showed that both non-farm payrolls and average hourly earnings were higher than estimated.
This reignited fears about the Fed continuing to aggressively raise rates to tamp down inflation. It would be fair to say that the Federal Reserve has struggled to read the tea leaves on data for some time.
On the subject of interpreting trends, Allstate held its special topic investor call on Friday with the focus being “Claims Practices and Reserving”.
Allstate has had a very difficult year in terms of results, with consecutive quarters of material reserve additions. On the other hand, Progressive has managed to successfully navigate the loss cost enviroment largely unscathed.
That said, many other carriers apart from Progressive have witnessed noise in their numbers as well.
As a result, there was continued interest in this call, and whether any specific new nuggets would come out that would explain why some carriers are witnessing more noise than the others.
Taking a step back, although the call added some incremental new color on reserves breakdown, difference in claims type (recent vs. historical trends) and attorney involvement shift, the discussion mostly built upon material from its earnings call.
Firstly, Allstate stressed the need to look at the recent development with a decadal lens for the entire company as opposed to personal auto only.
Longer-term, the company noted that its reserve adjustments have benefited results, hence the recent trends are an outlier. We struggle with that view since automobiles, driving conditions, pricing and competitors are in a very different place than they were before.
Our analysis in this note splits the auto and homeowners’ releases which point to a shift in trends. The plus is that auto is a short-tail line, and depending on the proportion of 6 month vs. 12 month policies, carriers will lap the results fairly quickly.
The second item that was up for debate was paid trends and how attorney involvement has changed them. With the court systems shuttered initially over Covid, data has been a bit too spotty to pin down accurate paid-to-incurred trends and revisit claims practices.
We reviewed the claims count data and noticed a longer-term shift in these trends vs. a recent change.
Thirdly, in terms of positive news, the company and the industry are witnessing an uptick in rate approvals in the state of California which makes up 12.4% percent of the company’s total personal auto direct written premium and 12.1% of the industry. Our note will later show historical rate levels and recent approvals.
The note below covers these three points in greater detail:
Firstly, on a statutory basis, personal auto reserve development has exhibited volatility
While loss costs are going up for all, carriers staying ahead of emerging loss trends will differentiate themselves from those companies playing “catch-up.”
The following charts show Allstate’s reserve development in both dollar and percentage terms, from 2012 through 2022 YTD. The right-hand chart also includes the development’s impact on the combined ratio. Cat losses are excluded.
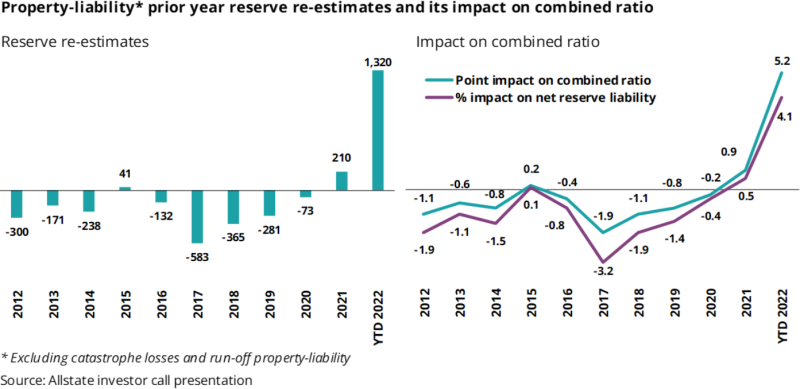
We see 10 years of stable-to-favorable development being met with a drastic reversal of development in 2022.
Allstate’s last two quarters of reserve charges have largely been attributed to soaring loss costs. While this isn’t wrong, a tardy assessment of trends has proven more costly to Allstate, than say, Progressive.
In a previous note that compares Allstate to Progressive, we showed how these companies are operating in the same space yet having divergent results. In this past year, as Allstate points to the macro environment for its reserve charges and climbing loss ratios, Progressive’s results have not been nearly as bad.
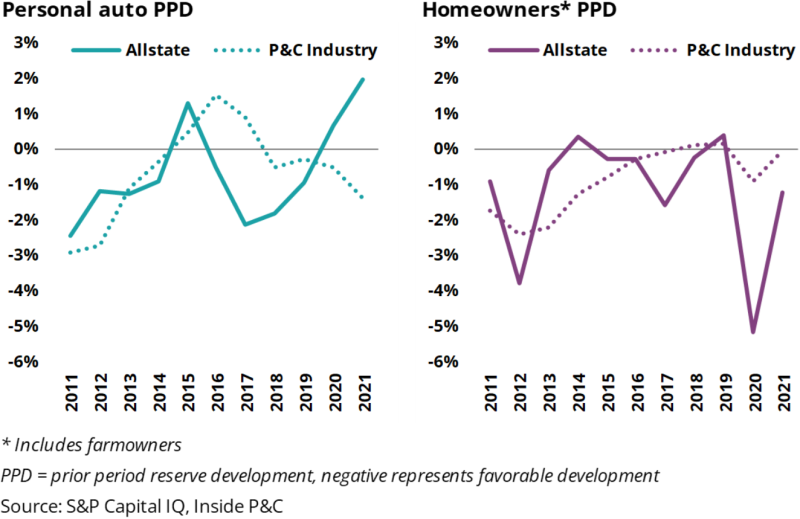
The following chart shows the prior period development (PPD) for Allstate vs. the P&C industry for both personal auto and homeowners’. While the industry has seen favorable development in personal auto, Allstate’s PPD continues to climb. For homeowners’, Allstate has had better development, but the company is seeing more volatility than the industry.
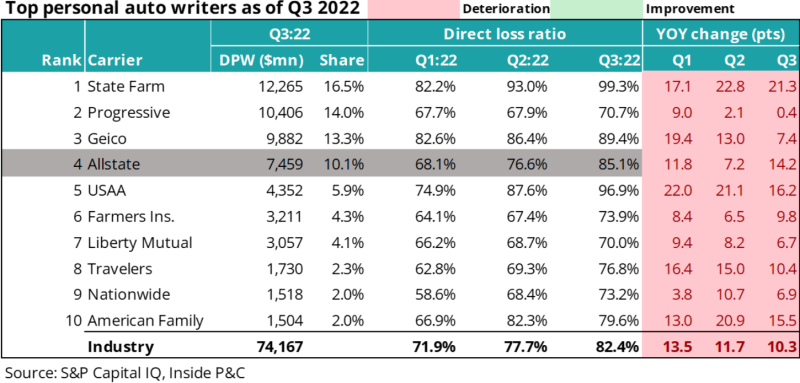
We recently analyzed quarterly statutory data for company and industry trends. For loss ratios in 2022, the personal auto insurance industry is seeing consistent deterioration. However, Allstate’s loss ratio increase in Q3 2022 is now above the industry median.
Meanwhile, Allstate’s smaller homeowners’ book is seeing some improvement against the industry.
The following chart shows the 2022 direct loss ratios for homeowners’, by quarter. It also includes the amount of premium for the major carriers and their representative market shares.
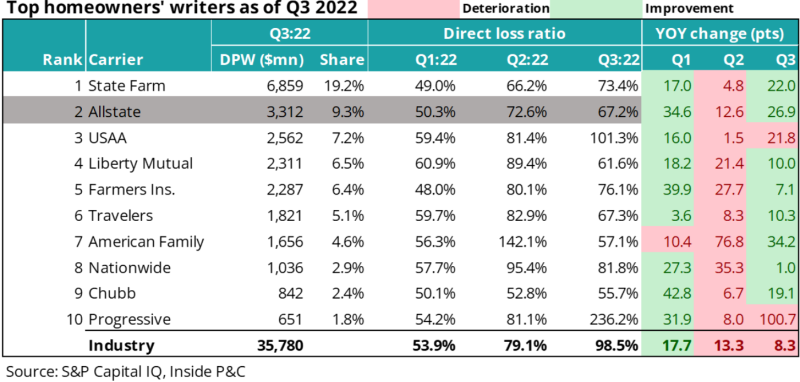
As shown above, homeowners’ should have a stabilizing effect on overall results.
Taking a step back, we believe that companies who were earlier in reacting to loss cost trends would benefit in the current cycle. Progressive has continued to reap these rewards in terms of growing its top line while other carriers continue to figure out what corrective actions to continue taking.
Secondly, the recent reopening of the courts is resulting in additional fine-tuning of trends
The reserving techniques used, especially for more stable business such auto and homeowners’, rely heavily on the development of historical losses. With something like Covid, and the resulting loss cost inflation and backlog of court cases that it produced, there is no analog on which to build loss development for those years.
Actuarial judgement will be put to the test, and we are already seeing conservatism make its way into the paid-to-incurred ratios.
The following chart shows 22 years of initial paid-to-incurred ratios. The ratio shows 20 years of consistency, albiet with some cyclicality oscillating between 37%-41%.
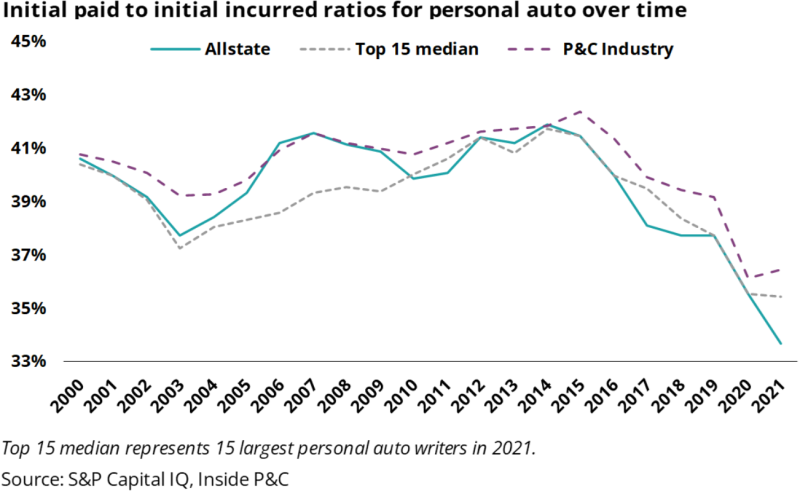
As more and more uncertainty presents itself, we see a sharp drop off in the initial paid-to-incurred ratio. Also, where the industry has seen a stabilization around 36%, Allstate diverges even lower.
This could imply that Allstate has less of a handle on the ultimate losses surrounding its personal auto exposures.
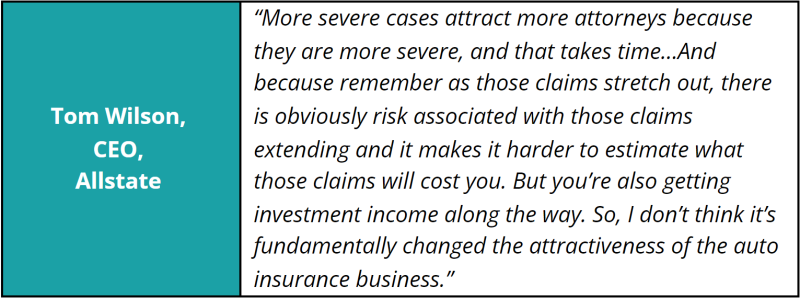
However on Friday’s call, Allstate attributed the lowering of its initial paid-to-incurred ratios to the longer-tail nature of bodily injury claims, especially the more severe cases, and the potential tort inflation that comes along with it.
Thirdly, rate activity is picking up
Allstate is aggressively trying to close the gap between current rate levels and its rate need.
One of the more challenging situations is in California, where regulators finally approved a rate increase for private passenger auto for the first time since May of 2020.
This rate increase should help Allstate combat the last 30 months of rises in auto loss costs – a period of time that has produced the most expensive car parts, labor, medical costs, and used cars in history.
From the call, Eric Brandt had this to say in regard to loss costs:

Allstate received an approval for a 6.9% rate increase in California. It has indicated 15% as its rate need. The approval should see an increase of $165mn in written premium working its way into Allstate’s book.
Since the beginning of 2021, Allstate’s nationwide rate filings have outpaced the industry.
With the (pre-announced) adverse reserve development of $875mn from Q3 2022 and $408mn in Q2 2022 (of which $275mn was from auto), its no surprise that Allstate is on the rate offensive.
The following chart shows the uptick in rate increases for 2022 for the Allstate brand, as well as National General.
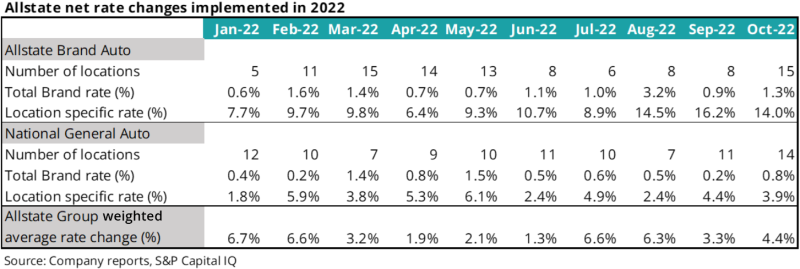
As we see above, the location-specific rate increases have been on the rise for the entirety of 2022, and Allstate will continue pushing the gas-pedal on rate increases into 2023.
As shown in the chart below, Allstate, as well as the P&C industry have received rate approvals through the end of Q1 2023.
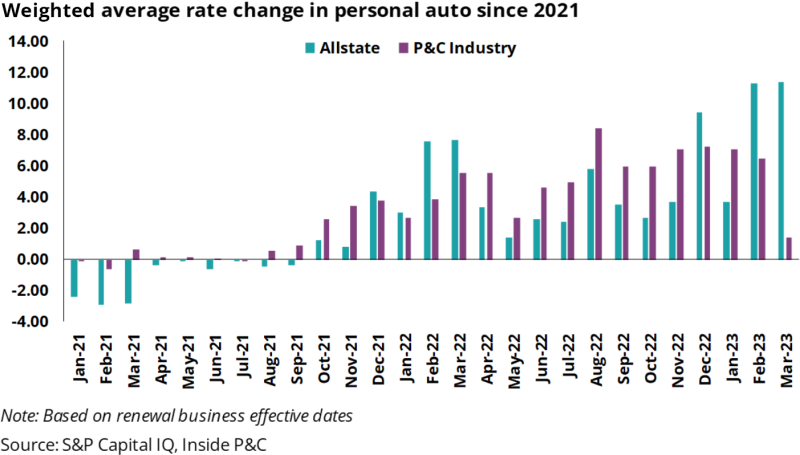
The chart’s x-axis shows renewal effective dates, and we see that recently Allstate is receiving rate approvals which are generally higher than industry.
Beyond the approved rate filings, we thought it would be interesting to see how many pending filings Allstate has out.
The chart below shows Allstate’s filings in 2022, separated by filing status.
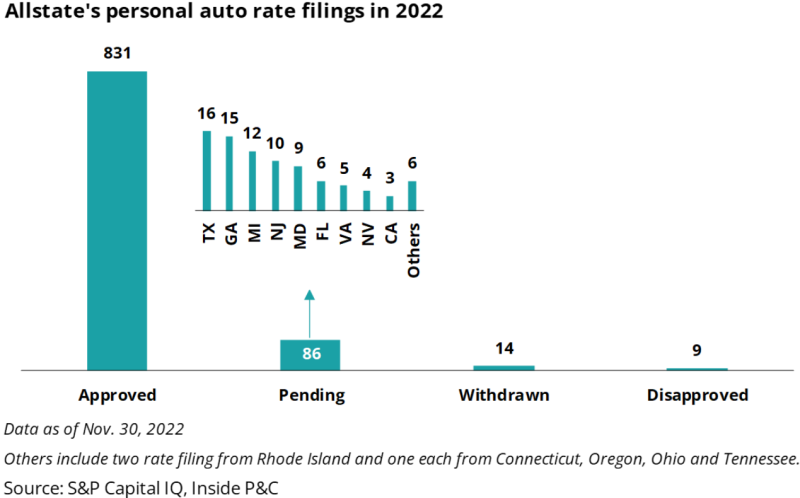
Of the 86 pending filings, we won’t yet know the rates indicated, but based on the rising loss costs, it’s safe to say Allstate will be looking to take rate in the states shown above.
These rate increases would require about 18 months to earn through, so the effects of these filings may not fully present themselves until late 2023 and beyond.
In summary, Allstate is seeing a very challenging year in 2022. If we agree with management’s assertion that the worst of the reserve charges are behind them, and the rate increases earn in with a more stabilized loss-cost environment, then the future could look a lot brighter.
However, almost everything has to go right for them, which means a light catastrophe environment, continued improvement in loss cost trends and competition. On the other hand, if loss trends deteriorate again, it will be déjà vu all over again.

