Many of these brands, but not all, came back after a successful first act. In fact, America is a nation of second acts, and we love a comeback story. We root for the underdog to win and return to glory.
That said, we’re more than happy that JNCO’s second act hasn’t taken off (yet). If only we could erase the memory of those ghastly collector’s edition tents.
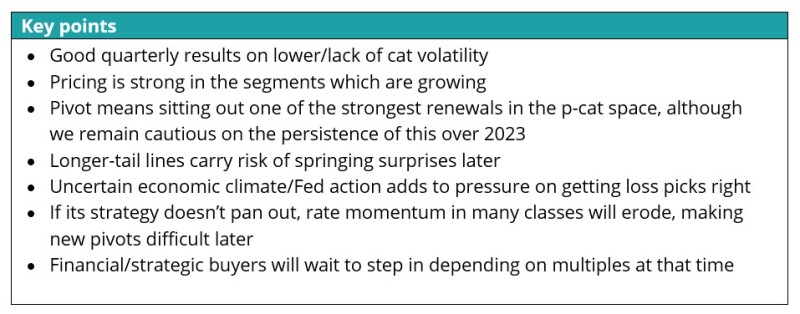
Talking of second acts, Axis reported its fourth quarter results on Wednesday, and the stock was up 7% at close of business. Sometimes the absence of bad news is viewed as good news. The company is in its pivot away from being a short-tail focused (cat heavy) underwriter, which has reduced the usual volatility from catastrophe losses.
The company is also in the midst of a CEO handover to Vince Tizzio, with Albert Benchimol retiring on May 4 and remaining as an adviser for the rest of the year. The assumption is that this handover benefits from Vince’s experience and will help Axis in its pivot, leaning further into non-cat lines.
This could go two ways:
One, the current hard market and the timing prove fortuitous, and these lines remain stable, and the rate vs loss trend gap helps Axis's margins to improve materially from here.
Two, property catastrophe management writers captured the hard market effectively and companies who sat out will look back in regret.
One or both or even neither of the above could end up being true over time. That said, it’s clear that Axis management realized that the old playbook was not working, something had to be done.
We have covered enough members of different classes of reinsurers over the past 23 years or so to be confident in at least one takeaway. Size matters.
Once the post-Katrina/Rita/Wilma hard market was done and third-party capital arrived, the ball game was going to be different. This drove a consolidation wave, whether willing or forced.
For Axis, the hard pivot at least ceases the constant side-eye of how long the company will attempt to navigate an increasing market embrace of specialty underwriters vs property-cat underwriters.
If the stock price is viewed as a proxy to distinguish between insurance sectors, specialty names tend to trade better than plain reinsurance underwriters. Over time, though for shorter time periods, reinsurers can outperform based on specific market directions.
First, over time, Axis will have to demonstrate how its pivot away shows returns which are better than volatile classes. Later in the note we show historic returns which haven’t been that great for some time.
Second, what is the right mix? Yes, in recent years, insurance operating income has trounced reinsurance income, and longer-tail lines will benefit investment income as well. There’s a lack of clarity on how the loss cost cycle will play out in a post-Covid world.
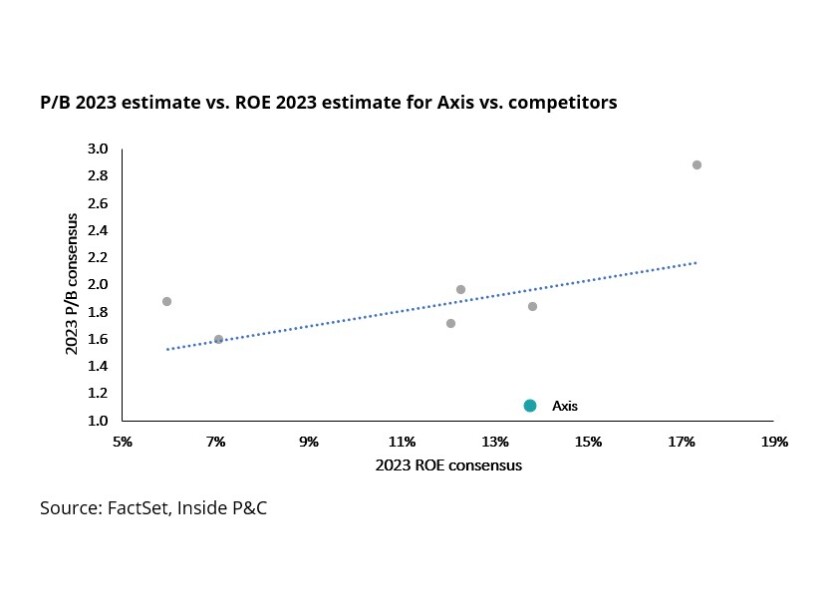
Third is the stock multiple. Depending on investment appetite and horizons, investors see different sectors of insurance differently. Yes, the stock seems undervalued compared to peers based on a valuation vs RoE regression analysis. But, looking at the multiples compared to value creation, Axis's record makes this a ‘show-me’ story at this point.
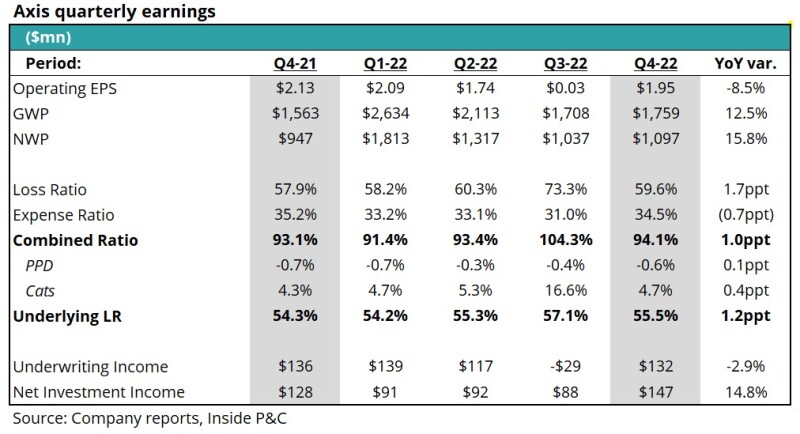
In terms of quarterly results, Axis reported better than estimated EPS. Operating EPS was $1.95 per share vs consensus estimate of $1.76. Top-line growth was strong, with net written premiums up 15.8%.
Year-over-year loss ratios were up 1.7pts with the combined ratio only up 1ppt. Underlying loss ratio was up 1.2pts, assisted by slightly favorable prior period development and relatively mild cat experience.
Below, we discuss the pivot, segment trend lines and valuation in detail.
Firstly, the pivot away from volatile classes comes at an interesting time in the reinsurance space.
As detailed in a previous note, Axis's pivot away from reinsurance comes at a time when rate is at historically high levels. In addition, as we saw this week with Travelers’ quota share arrangement and investment in Fidelis, there is continued evolution with new capital trying its luck in the marketplace.
The charts below give some perspective. The left-hand one shows Axis's decreasing reinsurance exposure via its lowered probable maximum loss (PML) over time, as well as the reinsurance combined ratio (as reported). The right-hand chart shows insured losses against Howden’s rates on line, both globally and just for Florida.
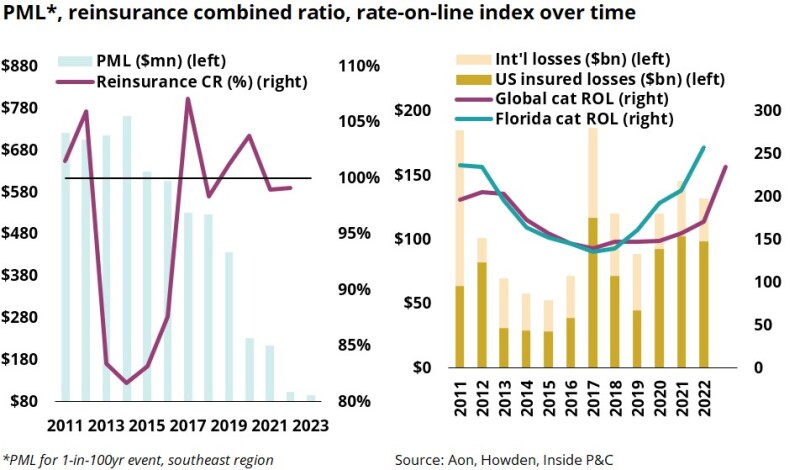
On the left we see that though Axis's PML is decreasing, the combined ratio has been volatile.
This is because in recent years the industry has witnessed an uptick in cat losses compared to long-term trends. This has also renewed debate over whether this uptick is the new normal and how to account for it.
We see a different view of this for the larger market on the right. Note the spike for the massive cat year in 2017 and the subsequent take-off of rates. The ROL trend is in line with the insured losses, with the US growing faster than globally, due largely to Florida.
Taking a step back, the cat loss volatility in recent years and the rate outlook compared to the capital base have made this class a tightrope.
We have seen this movie before, whereby several other carriers that were too late to pivot were forced to face their moment of reckoning via willing/unwilling exit from the public equity markets.
For the industry, we were more optimistic on the reinsurance (short-tail) pricing going into the year-end, but as discussed in our outlook, our position has evolved. It makes sense to negotiate hard at the 1 January renewals but if capital is not deployed it earns a zero rate of return and allows others to enter the marketplace.
Hard negotiation makes sense, but smart negotiations are better. Additionally, we continue to be cautious on the macro themes and wonder, if the broader economy starts to decelerate, whether property-cat can continue to perpetuate its cycle.
Taking a step back, the next few years will tell us whether this pivot has worked out.
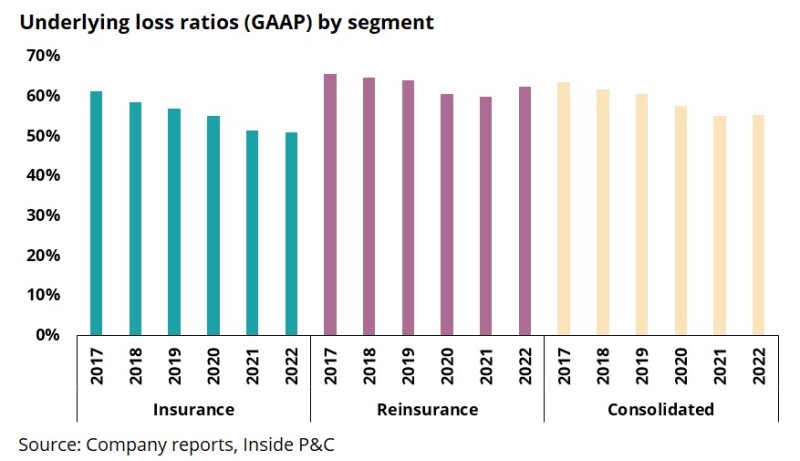
Secondly, results are good in insurance, but how do you factor in the uncertain loss cost inflation climate?
One of the broader themes for the industry over the past few quarters has been an attempt to discern the direction of loss cost inflation and if recent trends are transitory.
The following charts show the income and business mix evolution over time for the two segments (as reported). As WR Berkley’s Bill Berkley (our second reference in a week) says, reinsurance can be “chicken today, feathers tomorrow”.
But exiting a class of business can sometimes bring new challenges. From the perspective of managing capital and addressing volatility, the pivot throws up questions such as ‘are the loss picks right?’ and ‘how are we managing loss cost inflation and duration risk?’.
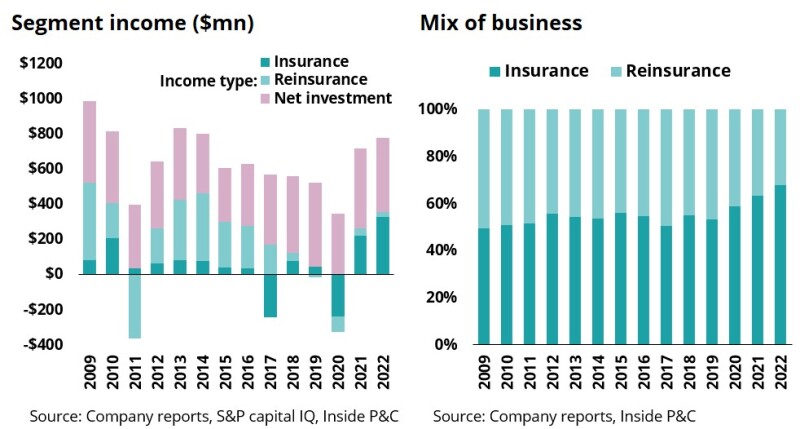
The table below shows stability and improvement in the insurance loss ratios at Axis, and will be the most important report card to look at over time.
Long-term stability will be rewarded while any noise will bring out the ‘I told you so’ whispers about the underwriting capabilities of this franchise.
Thirdly, yesterday’s stock move is all good, but now comes the hard part – bridging the value creation gap.
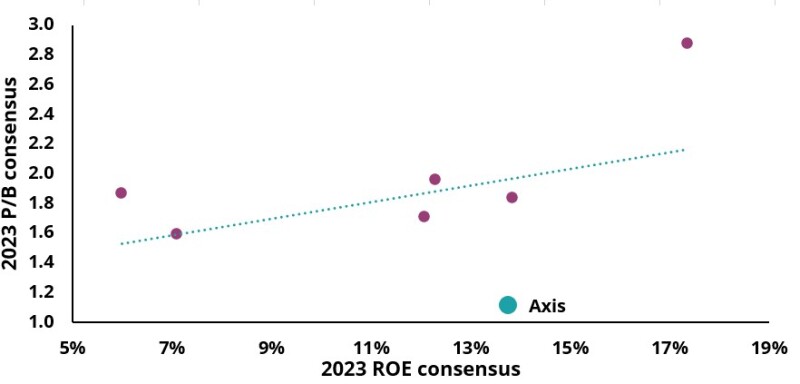
Taking a step back, specialty carriers tend to trade at the highest price to book multiples among insurance names. The chart below shows the price to 2023 year-end book multiple vs street projected RoEs for the group. Simplistically, companies trading below the line are undervalued and, in theory, this gap should close over time. That said, for this to happen, any carrier has to demonstrate stability in results over time.
P/B 2023 estimate vs RoE 2023 estimate for Axis vs competitors
Source: FactSet, Inside P&C
Axis is well below the line, suggesting it may be undervalued, so the question is: should we get excited about the future?
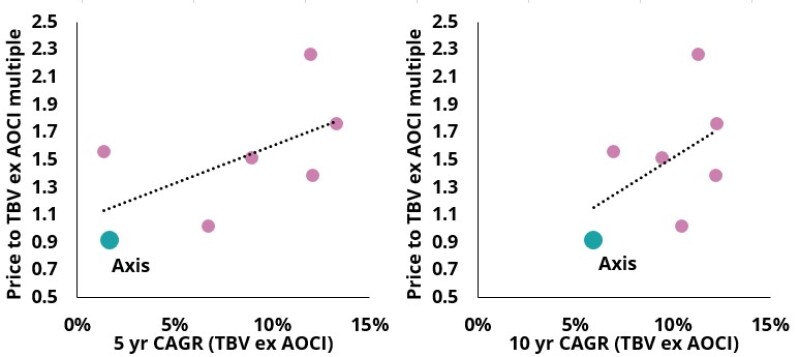
To answer this question, we looked at the value creation CAGR over the past five and 10 years, and set that against the P/B ex. AOCI.
Remember, value creation, which is book value plus dividend (common/special), is one of the true proxies of long-term performance. Higher value creators trade at superior multiples.
The charts below illustrate that Axis has struggled to outperform its peer group due to noise from cats and ranks on the lower of value creation CAGR (on a reported basis). So, while the valuation looks favorable against the RoE, we see that a record needs to be established to close the valuation gap.
Price to tangible book value (TBV) ex AOCI as of Q3 2022 vs CAGR (TBV ex AOCI basis)
Source: S&P Capital IQ, Inside P&C
The upside here is that if Axis shows superior results, it gets to close the gap and reward its investors and management/employees.
The downside is that if this strategy does not pan out, only difficult options remain. This will result in a reinvigoration of the historical discussion as to whether it makes sense to go it alone or whether the company is better served under a larger umbrella.
In summary, the pivot away from noisy short-tail classes has reduced the cat loss volatility. Now comes the hard part of executing on a long-term basis and bridging the value creation gap.

