This will be the latest in a slew of increases meant to cool inflation, and while there does seem to be evidence of a slowdown, we are still at historic highs.
While inflation has caused insurers to worry about rate keeping up with loss cost trends, it has helped prolong the broker super-cycle as these companies benefited from the pricing and exposure increases. In a high-level view, both insurers and brokers are involved in the same sector, but brokers, as the first derivative, are affected differently by the same trends.
So, in a complex economic landscape like the one we are in now, what factors will affect the industry uniformly, and which will have disparate influence on these two groups?
Firstly, both commercial carriers and brokers have benefited from the snap back in market conditions post Covid. Growth has been exemplary and mostly in lockstep. Our note below analyzes this and considers how much this trajectory will change over 2023-24.
Secondly, margins have been great, as this growth initially has netted down to the bottom line. Now comes the hard part of the self-graded exam, as the book seasons for commercial enterprises.
On the other hand, brokers’ expenses rose on talent additions aimed at bringing in growth. As the market approaches signs of stability, the focus will be on managing expenses amid rate deceleration.
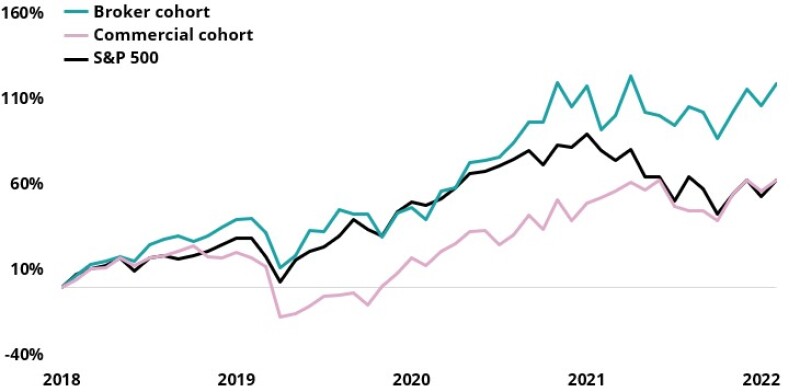
Thirdly, stock performance has differed between the two groups. From a three-year perspective, brokers have stayed above the market, while carriers initially underperformed before coming from behind with a significant outperformance in 2022, closing the gap that had built up over two years. With regard to estimates for 2023, the view on brokers has stayed stable over the past year, while commercial carrier estimates have been on a positive trajectory.
We look at these questions in more detail in the following note.
Firstly, there is a slight difference in trends related to growth metrics.
If you listened to recent earnings calls, you may have noticed a subtle shift in narratives. In the past couple of quarters, there was constant talk of the difficult macroeconomic backdrop and a lot of hedging on guidance. We even saw Chubb make its first change to its underlying loss cost estimates in several quarters.
This has been toned down a bit so far this quarter and, while we certainly aren’t optimists on the economy, brokers in particular seem to have dropped the ominous tone.
Last year on the Travelers year-end 2021 earnings call, there was not much mention of 2022, and analyst questions were met with an understandable reluctance to give guidance as the company was coming out of Covid and navigating the implications of Omicron and rising inflation.
In comparison, the company was more optimistic this year, framing everything in a more positive light and indicating its expectation for increased rate and higher profitability in the new year.
On the broker side, on the year-end 2021 call Marsh McLennan gave a very positive outlook, but along with a litany of macroeconomic issues. This year, the company acknowledged the difficulties in the industry, but as obstacles for its clients and carrier-partners that Marsh would help navigate rather than headwinds for the broker itself.
Leadership was optimistic, citing factors such as elevated inflation and increasing rates that would boost numbers through 2023, even going so far as to say the uncertainty and volatility in the world increases the demand for its services.
We remain cautious on these expectations in the face of a possible recession, and Marsh McLennan acknowledged that its view assumed no shift in the landscape.
Whether these predictions come to pass, they do represent a fresh stance on the marketplace. Seeing this emerge, we looked at key market indicators to see if this would be reflected in a similar divergence in trends in correlations with economic indicators.
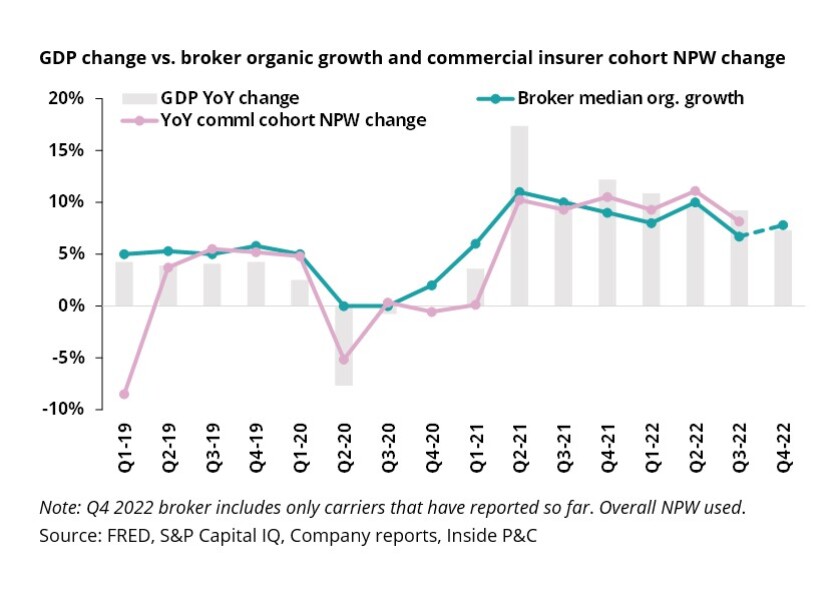
The first metric we looked at was GDP. The chart below shows the GDP change compared to net premium written (NPW) change and broker organic growth, both as averages for the cohort.
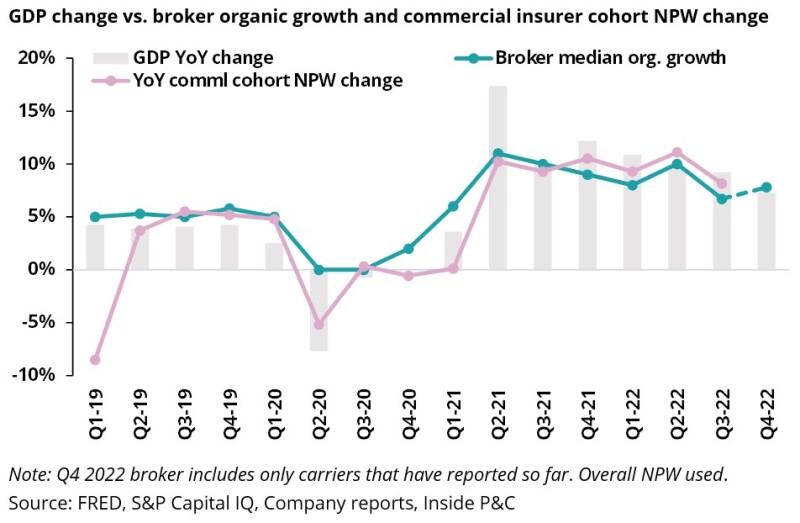
This clearly tracks well. Brokers are in almost perfect alignment with GDP growth, and commercial carriers are nearly as close, with a bit more noise.
Another key item is inflation. This time we have used general inflation (all urban consumers CPI) and compared it against the broker revenues and commercial pricing from CIAB.
Broker organic revenue and commercial pricing change vs. inflation*

*All urban consumer CPI
Source: Company reports, CIAB, FRED, Inside P&C
This is where we start to see trends diverge. Broker revenue still correlates well with inflation, but commercial pricing does not follow the trend. The main reason for this is that the pricing metric does not include exposure, while the broker number does.
So, what does this mean for the future? Taking a step back, if the economy falters it is likely that even if pricing numbers remain strong, exposure growth will go down, which will have a more profound effect on the brokers.
Secondly, broker and carrier numbers tell a similar story on profitability, despite wage inflation.
As the various CPI metrics grew to unprecedented highs over the past couple of years, a number of concerns moved front and center as those increases hit loss costs. While brokers may not have all the same issues as carriers, one type of inflation they are subject to is wage inflation.
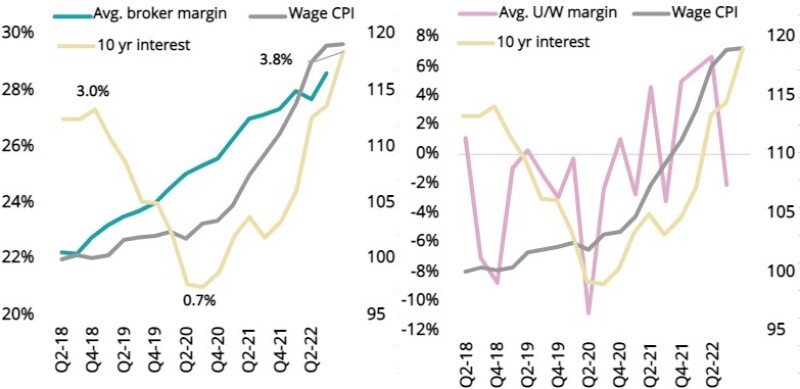
The effects of these large increases were something we had hoped to hear a little more about on the earnings calls, but so far we haven’t heard a lot. So, we decided to get a sense of whether or not this is affecting these companies by looking at profitability metrics against the wage CPI as well as the interest rate as a proxy for loss cost inflation.
The chart below shows the results, with brokers on the left and large commercial carriers on the right. For the brokers, growth has contributed to margin expansion outpacing wage inflation pressures.
For the commercial insurers, loss cost inflation has been benign, in part due to a slower than anticipated reopening of the court system. This has continued to benefit underwriting margins, notwithstanding the noise from catastrophe losses.
Taking a step back, for commercial insurers, it remains to be seen if earned rates can outpace the growth in loss cost inflation if the Fed continues to raise rates and the court system reopening leads to catch up claims coming through the system.
Broker margins and commercial carrier underwriting margins against wage inflation
Note: Wage CPI indexed to Q2-2018
Source: BLS, Company reports, S&P Capital IQ, Inside P&C
Thirdly, stock price, multiples, and estimates show a distinct difference in trajectory for 2023.
The charts until now have shown how revenues and growth are tied to GDP and inflation. However, that similarity doesn’t exist everywhere, and despite being affected by the same underlying numbers, the impact on these companies’ stocks tells a different story.
The chart below shows the change since 2019 for the median of each cohort, with the S&P 500 as a benchmark.
Median stock price development for the broker and commercial carrier cohorts since 12/13/2018
Source: FactSet, Inside P&C
Brokers as a group have overperformed over the past three years, and carriers have generally underperformed (due to the challenges of the times). Note that carriers have rallied in the past year to close the gap with the S&P that had developed over the three-year period.
Taking this a step further, we looked at the price to forward book numbers for all the companies in these groups. The chart below shows the January 1 estimate for year-end for each of the past six years.
Broker vs. commercial carrier price to forward earnings* estimates since 2018
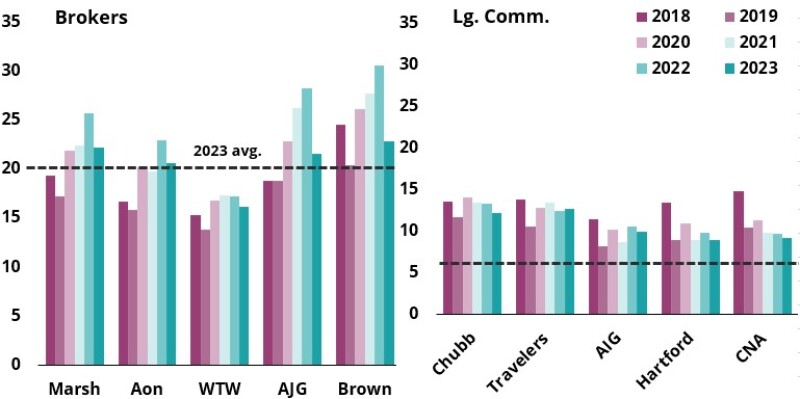
* Each estimate is as of January 1 of the previous year
Source: FactSet, Inside P&C
All else being equal, brokers’ trading multiples did benefit materially while commercial insurers’ were mostly range bound.
We also examined the estimate trends for 2023 in the chart below, and it appears that commercial insurers are being priced for perfection while broker estimates have largely stayed stable over 2022. These trends are particularly good in view of the major downturn in S&P estimates.
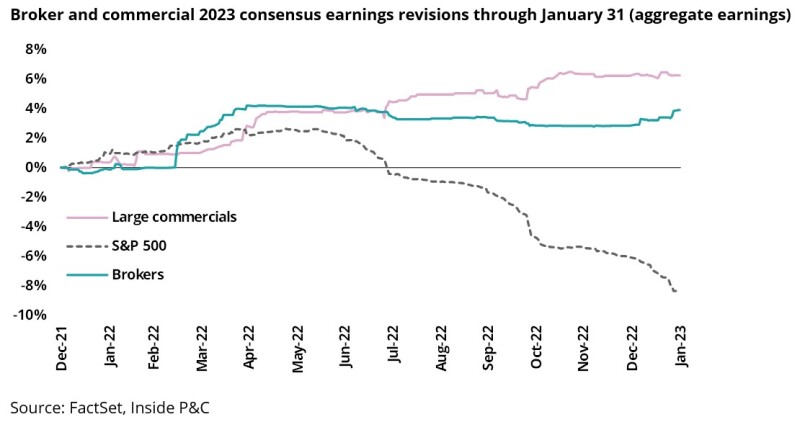
Theoretically, this makes sense. Commercial insurers earn in the high rates they charged over the past few years, while the broker model is essentially a pass through, and their earnings have already reflected the good news.
Conversely, this also sets up the commercial group for negative surprises if they are unable to meet the trend line. As discussed in our outlook, we remain cautious on the rate vs. loss cost trend and expect a rebound in loss cost inflation over 2023 beyond what is being discussed on the earnings call.
In summary, while brokers and insurers face many of the same headwinds and tailwinds, their performance in the face of these obstacles doesn’t always trend the same way. Both track in line with economic indicators, but stock price performance diverges significantly, and estimates anticipate a higher-than-expected performance from carriers. It remains to be seen how this scenario will play out, and how much variance we will see from these trends if a recession does materialize.

