It is interesting to note that, outside of auto-related issues, this economic noise has not translated into loss costs quite the way we thought it would. With interest, wages, and other indicators on the rise, we might have expected to have seen a general spike in loss costs, but we haven’t seen that materialize for most of the casualty lines.
However, calls in the past earnings season focused on the gap that still exists between loss costs and earned pricing. Although most of the reserving noise has been centered in short-tail personal auto due to inflation, there is some creeping anxiety on longer-tail lines as commercial lines pricing plateaus, and interest rates are elevated.
The note below covers industry and individual reserve development for the first six months of the year, as well as looking at the Floridians who are the hardest hit by recent events.
The industry reserve release trend is positive, but continues to slow
In our mid-year reserving note last year, we pointed out the beginning of a downward trend from 2021 to 2022.
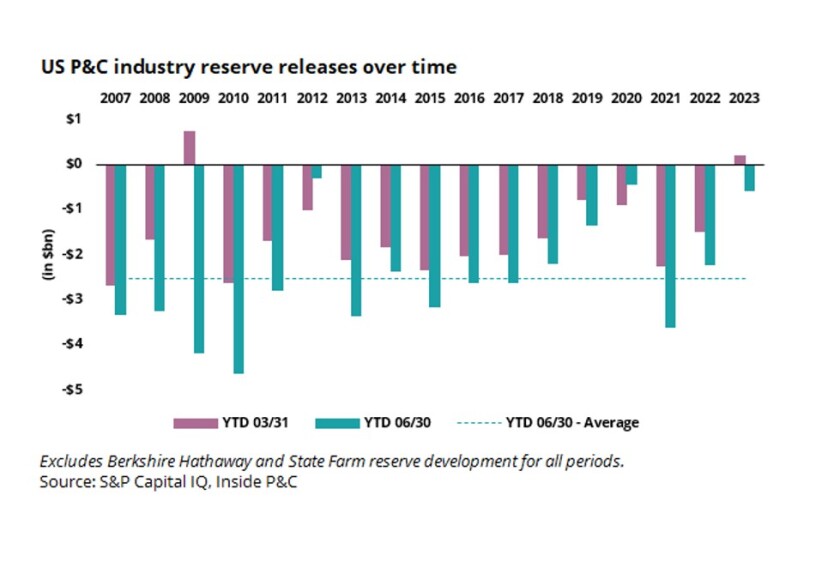
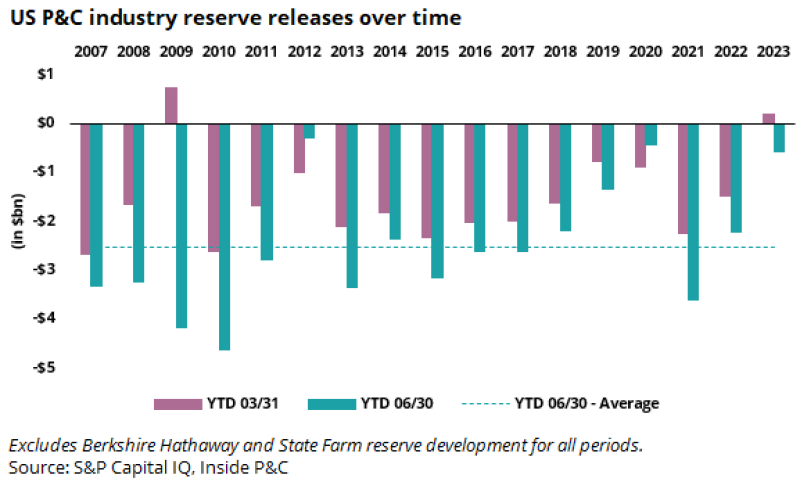
While this year’s results are still showing positive releases, we can see in the chart below that the downtrend in their magnitude is now even more clear.
The mid-year number for 2022 is already below average, and mid-year 2023 is the third lowest year since the financial crisis, and only the second year during this time frame to have a net adverse Q1 (excluding Berkshire Hathaway and State Farm).
Industry commentary has stated that the Covid years led to significant reserve redundancy in 2020 and 2021, suggesting we might look for an upward trend in releases, or at least for the higher volumes to continue as some carriers “eat the marshmallow” and release reserves for the shorter term benefit. So what is causing this discrepancy?
The first major point here is that there are distinct trends interacting to create the overall numbers: short vs. long tail, and personal vs. commercial. The Covid years reduced the number of drivers on the road and the number of people in the office, reducing the frequency of certain events. But on the other hand, inflation is not returning to normal, which could spell trouble for the long-tail lines that were driving releases.
The second point to consider is that this is the industry aggregate, so it is being driven by potentially unrelated positives or negatives from individual companies. As company-level data will show in the next point, the driver for the above is personal lines adverse development offsetting longer-tail releases.
Results on a company-level basis are mixed, though with an overall positive trend
The industry’s slowing positive trend on releases is the result of plusses and minuses from carriers on a wide spectrum, so while it indicates the general direction the releases are trending, it can miss a lot of the story.
The chart below gives us two additional views. First, we can see the individual reserve release trends and which names are consistently green (releases) vs. those which are all white, or fluctuating between the two.
Second, we can see the number of companies that are green in each column is fairly consistent. Of the top 20 carriers shown below, at least half have reserve releases every year. Only the names and volume shift.
Note the analysis below looks at development as a percentage of prior reserves and should not be confused with points of reserve development as a percentage of earned premium. This is a limitation of quarterly statutory data where earned premium is not available.
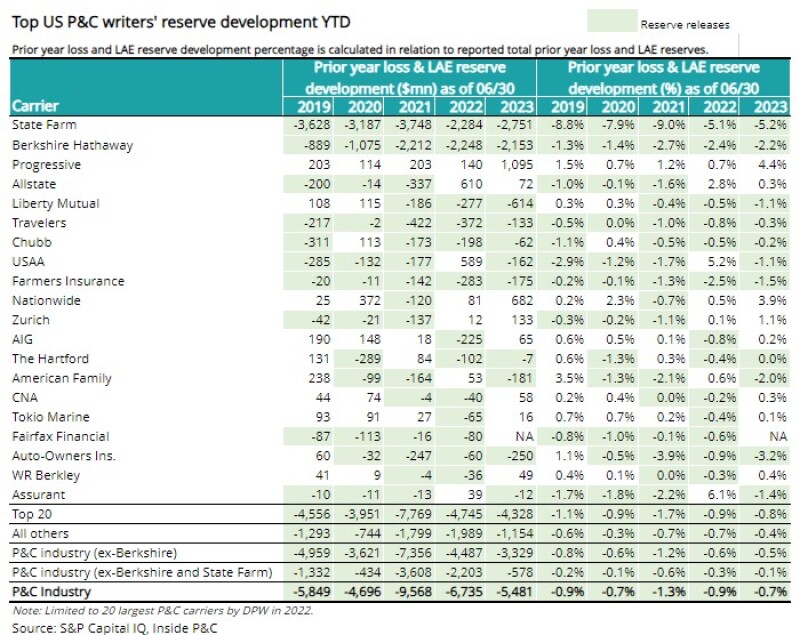
So, while we do see the slowing on an aggregated basis, this chart makes it clear that this is just the surface. Actual releases vary significantly by firm, particularly comparing 2022 to 2023 where we see the Covid-related releases.
However, we can also start to see the interplay with longer tail lines, with generally positive trends from longer-tail releases interrupted by massive adverse development for personal lines players, particularly Progressive and Nationwide.
Florida reserving trends are a head-scratcher
Seeing the difficulty faced by even the top players above, we wondered about the situation for Floridians.
In the wake of Hurricane Ian last year and the preceding catastrophes that have chipped away at the list of Florida-domestics, the chart below is particularly interesting. It shows the same data we examined above for companies with 30% or more of their business in Florida.
We might expect, given the industry and big-name trends, and the additional pressures faced by this group, to see a serious drop-off in reserve releases here. But surprisingly, the trend is positive.
We would note that the dollar amounts are small, but looking at it on a points basis, many releases are materially higher than we see for the top players. However, the aggregate line at the bottom shows that, unlike the larger carriers, this trend is inconsistent, and the group fluctuates between significant favorable and adverse, driven at least in part by struggling companies (UPC, for example).
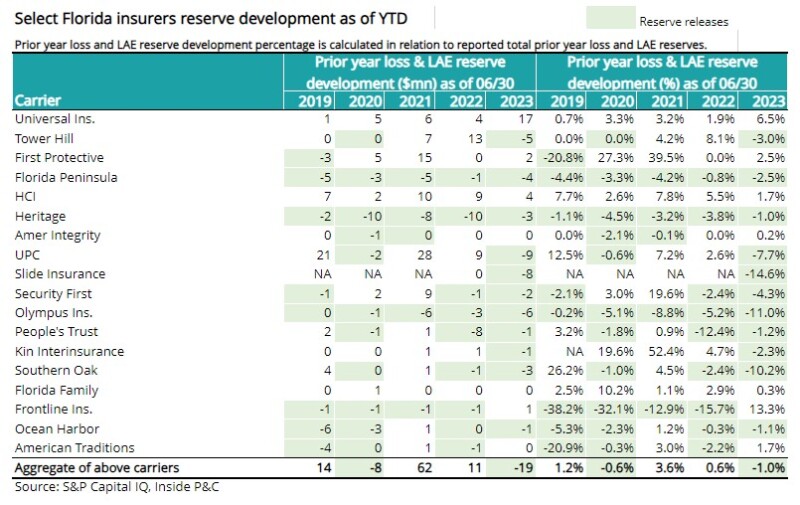
This positive trend in the face of current events can only be due to one of two reasons: 1) Trends have improved to such a degree that companies are comfortable releasing reserves. 2) The group feels pressure to show positive trends to convey that all is well in the marketplace and hence dip their hand in the cookie jar sooner than expected.
We lean into the second camp and this trend makes us a bit nervous, especially should tort reform prove insufficient.
In summary, we continue to see a positive reserving trend for the industry on an aggregate basis, though the trends differ materially for short and long tail lines, causing individual trends to diverge.
However, in general, most carriers continue to show favorable development, with long-tail releases continuing to overshadow adverse development in short-tail/ personal lines.
We would caution that the downward trend is still concerning, and may hint at issues to come, as long-tail lines deal with the impact of inflation that has not returned to pre-pandemic levels.

