In sync. No, not the boy band from the 1990s. When looking at industry trends, we often look at both reserving and claims count data to see if the trends are in sync.
Last year was pivotal for the industry, with worsening reserving trends, albeit not at the level we expected. Additionally, for full-year 2023, much of the bad news from the soft market years in general liability lines was offset by workers’ compensation reserve releases.
We revisited the trends with the recently released Q1 data to see if the 2023 trajectory persisted into Q1 2024. We also examined historical claims count data to see what stuck out in 2023.
First, Q1 reserve releases were higher than the prior trend line. We would note that reserve releases tend to be higher in Q1 2024 and worse in the fourth quarter, as this quarter also marks the completion of deeper-dive reserve studies. However, what is surprising is the reversal of trends seen from year-end 2023, with the first-quarter reserve releases dialed up.
Second, by-company data shows divergence, which likely reflects different participants expecting different loss cost environments.
Third, a look at other liability claims count data as a proxy for general liability left us concerned about potentially adverse trends ahead. We discuss these points in detail below.
The downward reserving trend that began in 2021 has reversed in Q1 2024
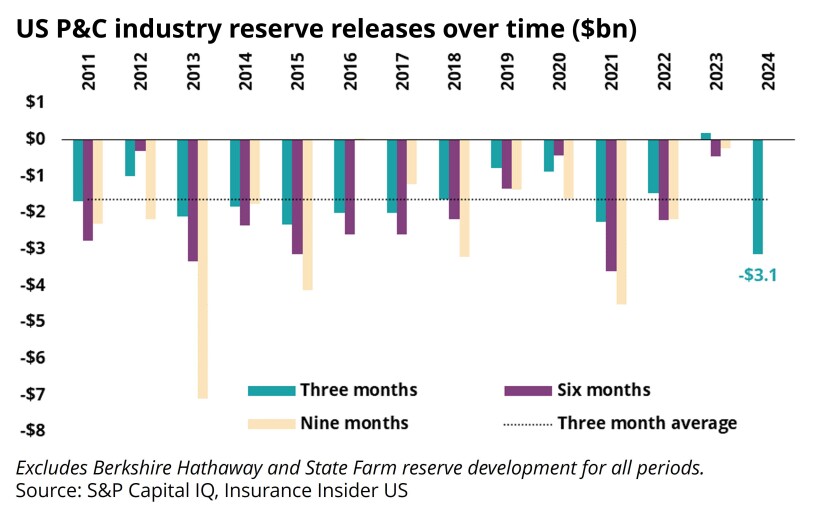
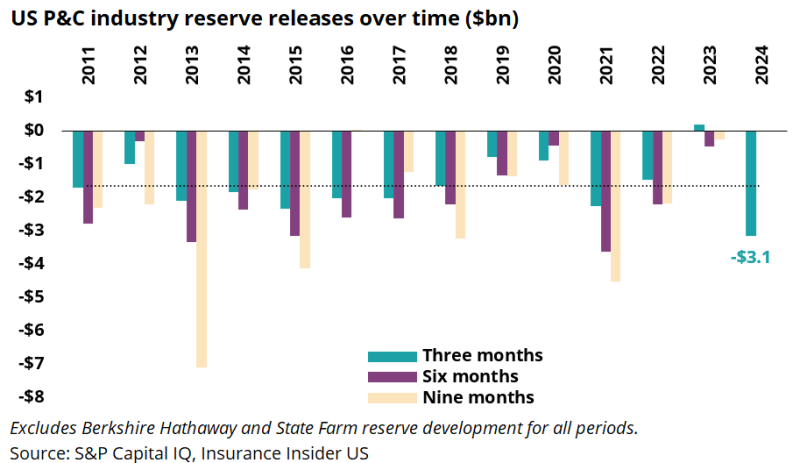
The chart below shows industry reserve releases over the past 13 years in year-to-date periods. In our 2023 mid-year reserving note, we observed a clear downward trend beginning in 2021, brought about by adverse development in personal lines, offsetting releases in the longer-tail lines.
The trend continued through 2023, with the industry experiencing adverse development of $0.2bn in Q1 2023. This was the only first quarter period in the 13 years we observed in which the industry (excluding State Farm and Berkshire Hathaway) did not have reserve releases.
The worrying downturn seemingly reversed in Q1 2024. The industry experienced above-average reserve releases of approximately $3.1bn for the period, compared with the three-month average of $1.6bn. However, it should be reiterated that reserve releases tend to be higher in the first quarter.
This begs the question: Is the industry still too optimistic and not fully recognizing the early lessons from the adverse soft market reserves? We believe this is likely.
Results are mixed at the company level for top writers, reflecting a lack of consensus on where loss cost trends are heading
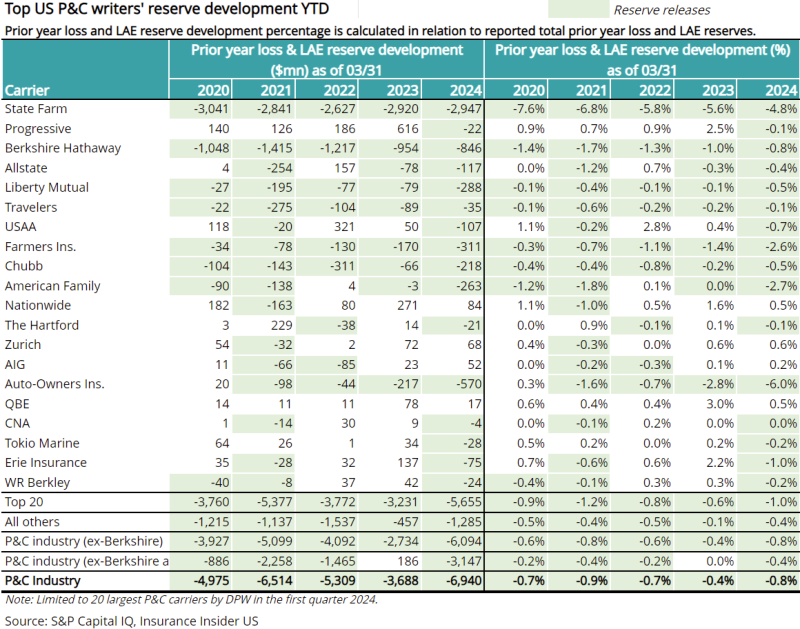
The chart below shows year-to-date reserve development for the top 20 P&C insurers. Drilling down to this company-level data, we can observe which carriers’ reserve developments are mixed and which are consistently favorable.
Of the top 20 carriers, only six have managed to maintain favorable reserve development over the four-year period we observed. The rest have experienced one or more periods of adverse development.
State Farm and Berkshire Hathaway are among the least volatile carriers listed. When excluding them from the analysis, we find that the rest of industry actually had adverse development in 2023. The 2021-23 downward trend and subsequent inversion in Q1 2024 remains visible, regardless of State Farm’s or Berkshire Hathaway’s inclusion.
Note that this analysis considers development as a percentage of prior reserves, not points of reserve development as a percentage of earned premium. This is because earned premium is not available in quarterly statutory data.
This data signals that opinions vary on the direction of loss cost trends, with some companies more optimistic than others. We also saw this play out in the recent earnings cycle, where there wasn’t complete agreement on the loss cost trends trajectory.
First-year claims reported rose in 2023 for other liability, with a near +20% spike in claims made
With all the optimism baked into the first quarter reserve release numbers, we revisited the claims count data for year-end 2023 for the other liability segment as a proxy.
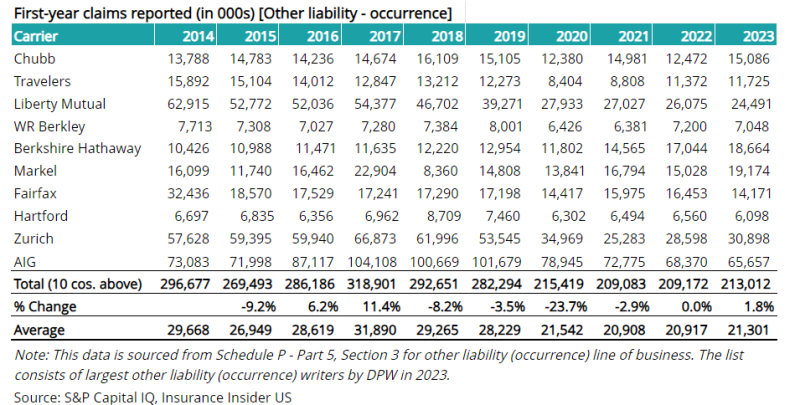
The table below shows the first-year claims reported by the top 10 writers of other liability (occurrence). After falling for several years, both prior to and during the Covid-19 lockdowns, the number of claims remained unchanged in 2022 and increased by nearly 2% in 2023.
The table below shows the first-year claims reported by the top 10 writers of other liability (claims made). Unlike other liability (occurrence), this line of business has remained largely rangebound over the past 10 years, most recently spiking in 2023 with a 19.3% year-over-year increase in claims reported in 2023.
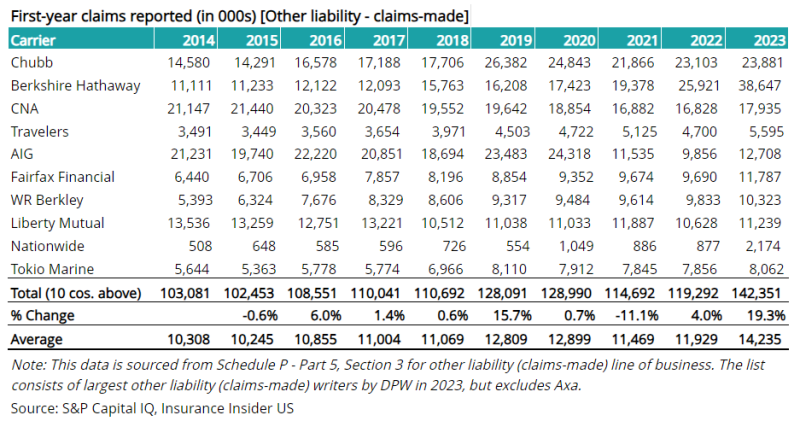
This claims data uptick gives cause for concern. Other liability made up 24.9% of the industry reserves in 2023. If this claims data is any indication, we would not be surprised if recent accident years also show reserving challenges.
In summary, the downward shift in reserve releases from 2021 to 2023 has reversed in 2024, making us question whether the trends have truly improved or if the industry is simply continuing to kick the can down the road.
Company-level analysis shows mixed results among individual carriers, likely reflecting disparate opinions on future loss cost trends. Lastly, first-year claims reported by the top other liability lines writers show an uptick, and this disconnect could pave the way for reserve deficiencies in recent accident years.
