Over the past few years, a hard market in both commercial and personal lines has enabled the resurgence of insurance vehicles such as MGAs and fronting companies.
On the fronting side, growth has been enabled by attention from private equity firms that have expanded capital deployment in the space.
PE has seen fronting as an increasingly attractive investment in recent years, owing to its relatively capital-light model and a growth rate that outpaces the rest of the P&C market. Investors have also viewed fronting’s above-market growth as a secular shift driven by the migration of business towards MGAs, itself caused by factors like their ability to attract on new technology and attract talent.
Against that backdrop, we updated our prior analysis to evaluate fronting firms’ business mix, loss ratios, and growth over time.
Our analysis shows a substantial slowdown in fronting company growth, and it is our belief that the meteoric growth of fronting seen after the pandemic will continue to slow down. This is due to a combination of factors, including an uncertain loss climate, related slowdowns in the MGA space, and high-profile issues suffered by certain fronting companies in 2023 and 2024.
Growth has nearly halved in 2024 when compared to prior years
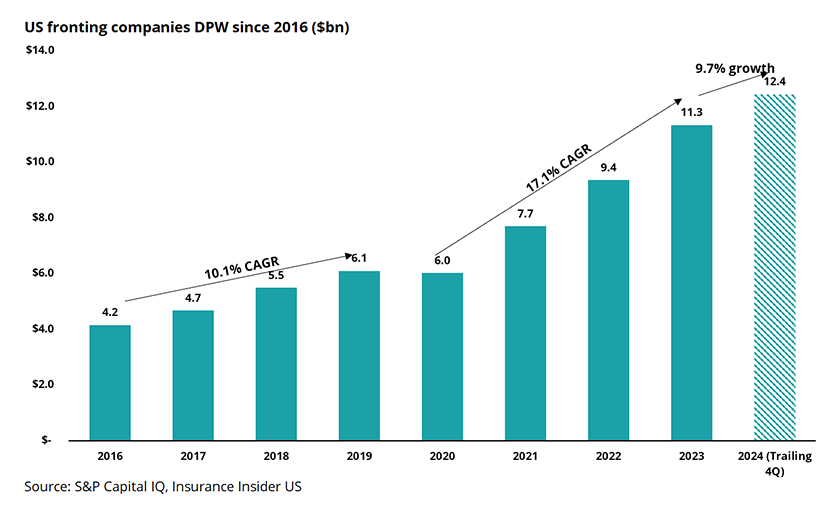
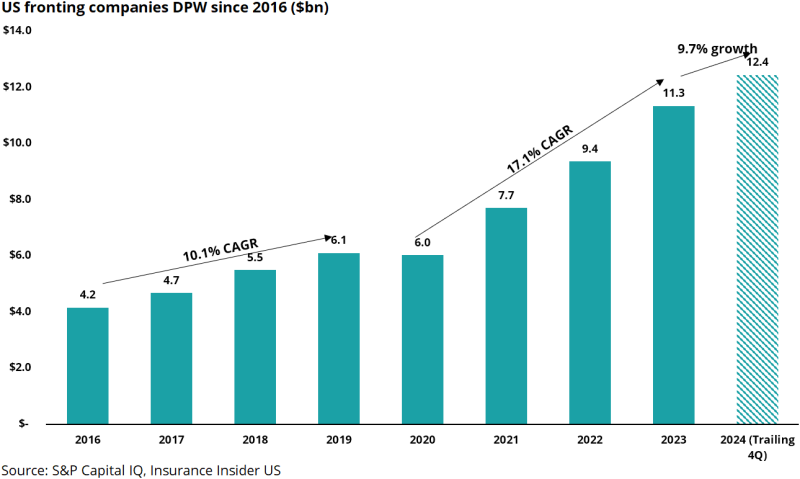
On an overall basis, the fronting market writes more than $12bn in direct premiums. The chart below shows this growth over time. Notably, the trailing 12 months’ 2024 numbers were up just 9.7% on a sequential basis, compared to a compound annual growth rate of more than 17.1% from 2020.
As mentioned earlier, a few factors might be at play here. It may reflect slowing growth in the MGA market, given fronting growth is derivative of flows from MGAs.
It could also reflect a loss of market share, with more MGA capacity coming directly from insurers as opposed to reinsurers working with fronts.
The fronting market also saw a number of incidents in 2023 and 2024 that damaged its reputation and increased pressure on the segment.
The downfall of Vesttoo last year notably created fallout for Clear Blue, a major fronting group which experienced negative growth in the first 9 months of 2024 when compared to 2023 (see appendix). Other issues such as Trisura’s reinsurance impairment, Sutton National’s issues driven by owner 777’s travails, and R&Q’s distressed sale of Accredited have all further added to the negative noise.
The real test for the fronting market will come in the next few years, if it does have to contend with much lower trend growth. The market is already overcrowded and private equity firms are already struggling to monetize their fronting investments at the levels they have them marked in their portfolios.
Slower growth will only intensify competition for business and exacerbate the challenges PE has in finding attractive exits.

Challenged lines such as private auto and other liability make up the largest piece
The chart below shows the main lines of business written by fronting companies, by percentage of our composite’s direct premiums written.
Personal auto has continued to grow based on rate improvement seen in the marketplace due to pressures from loss cost inflation. While personal auto's share has continued to grow this year, we would note that the rate of growth has slowed when compared to last year. As this market becomes more rate-adequate, it remains to be seen if this grows or contracts as competition heats up over 2025.
On the other hand, homeowners’ share has continued to decline as the E&S market has played a bigger role in addressing the dislocation caused by primary insurers pulling back in certain regions.
On the commercial lines side, other liability, commercial auto, and commercial multi-peril make up close to 45% of the business mix.
Although expansion of commercial lines seems to have slowed when comparing 2024 to 2023, any year-end reserve adjustments would lead to additional expansion as troubled long-tailed lines continue to flow towards E&S, MGAs, and fronting carriers.
Loss ratios have improved, but the book is not fully seasoned
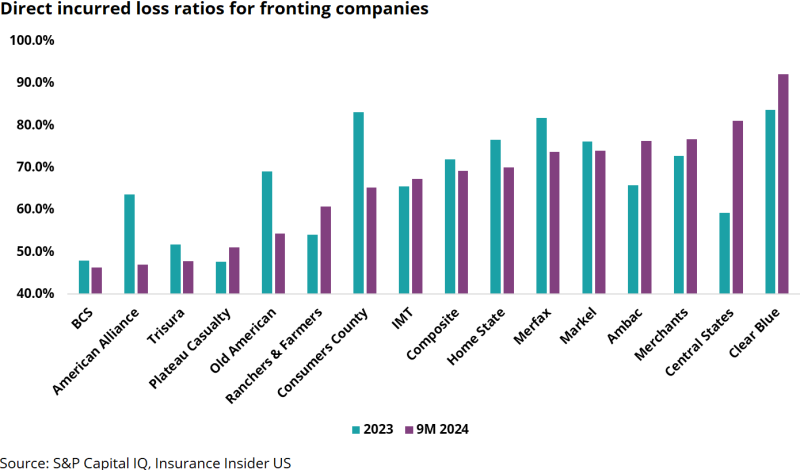
The chart below shows direct loss ratios for fronting companies. Note that fronting companies will, by definition, cede out the overwhelming majority of their risk. These numbers should be evaluated for their directionality, not their comparison to the loss ratios reported by more traditional carriers.
For the first nine months of 2024, the loss ratio for the composite shown below was 69.3%, and it was 72% for the full year 2023. The chart below compares groups with different underlying businesses, which will have different loss ratios. We would note that these are direct numbers, and net numbers would be materially low based on fronting relationships and how much is being shared with the partners.
Additionally, our analysis uses a schedule F analysis to reverse engineer the top writers, and one of the limitations is that it's not 100% representative of the actual fronting market and carriers.
Nevertheless, across the composite, eight groups' loss ratios were down, with seven being up for the first nine months of 2024 when compared to year-end 2023. These numbers will likely change when we see year-end results for 2024.

APPENDIX: Premiums by company
The table below shows different fronting companies and their parents.
