Data stories that defined the year: 2024 in charts
  • X
  • LinkedIn
  • Show more sharing options
  • Print
  • X
  • LinkedIn
  • Free Trial
  • Log in

Data stories that defined the year: 2024 in charts

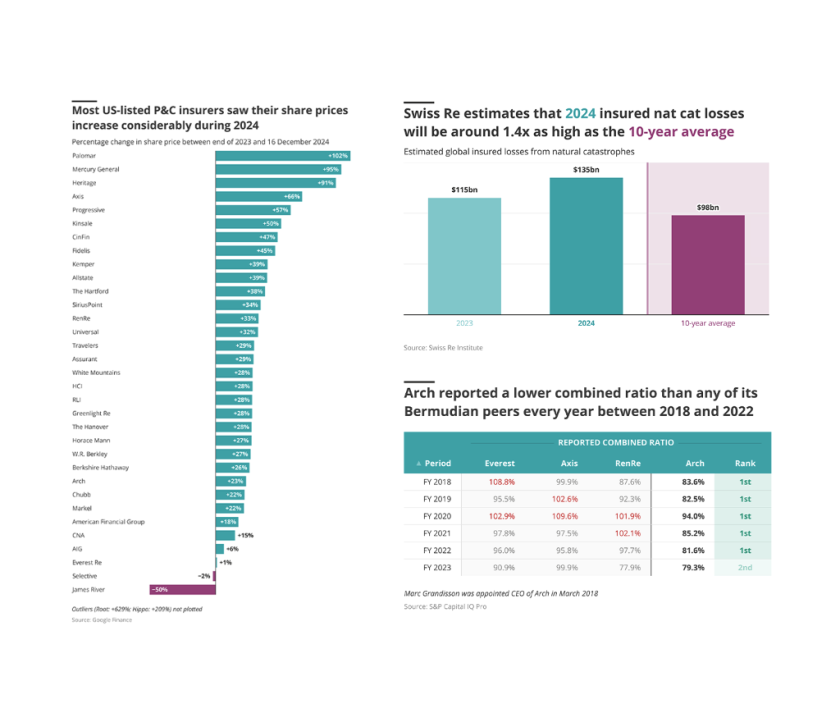
A look back at the year in P&C (re)insurance, with the aid of some of our visual journalism.

  • X
  • LinkedIn
  • Show more sharing options
  • Print
  • X
  • LinkedIn
d main b.png

Over the course of the past year, we have published hundreds of data visualization at Insurance Insider US to provide you with more insight into the P&C (re)insurance market.

As

Request a free trial:

Fuel a smarter strategy with our actionable market intelligence

    • Gain a competitive edge and accelerate decision-making
    • Be empowered by insights that transform confusion to clarity
    • Uncover growth opportunities and prepare for potential threats

Topics

Gift this article