
April 2025 has been a chaotic month for the world, particularly in the United States.
President Donald Trump’s announcement of sweeping new tariffs on April 2 sent global markets into a freefall, just for him to announce a suspension of many that caused markets to partially rebound a few days later.
Investors have anxiously watched as Trump’s trade war with China has escalated, tariffs have been threatened, imposed or postponed, and the president publicly explored ways to remove Fed chairman Jerome Powell from office.
P&C insurance, however, has remained a relatively stalwart sector in the stock market despite taking some losses in April. We predicted that insurers will be able to manage this crisis and are happy to report that, so far, they have... at least when compared to the S&P 500.
However, we would caution against future expectations of P&C outperformance. Present macroeconomic issues might not be enough to cause insurance stocks to give up a lot of ground, but there are other issues at hand.
As discussed last week, investor sentiment could turn against the industry due to concerns around overvaluation, reserving and pricing, combined with the macro issues. The likelihood of continued market volatility and economic contraction could therefore be the straw that breaks the camel’s back for insurance stocks.
Below we show how the sector has performed in terms of its market cap growth from January 1, and an analysis by segment showing the drivers and anchors of their growth. Additional looks at future earnings expectations and short-interest levels also give hints of where investors and analysts expect P&C securities to go from here.
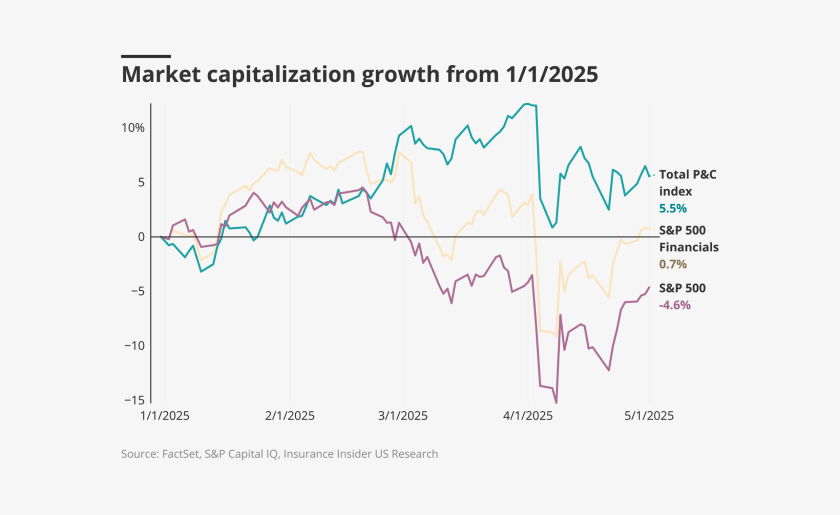
P&C continues to outpace the S&P 500, but some segments have fallen behind
When we last examined P&C stocks following the April 2 tariff announcements, we made the prediction that insurers’ generally conservative investment portfolios and the low demand elasticity for insurance products would insulate them from the tariff chaos that continues to wreak havoc on the market.
Following that note’s release, insurance tickers took their delayed share of the beating. Nonetheless, our index of P&C stocks has consistently outperformed the S&P 500 by a delta of at least 9 points in April. It ended the month 5.5% above where it started the year, although this is below its peak of 12% from April 3.
While P&C largely mirrored the fortunes of the broader market for the first half of the month, some lackluster earnings results depressed the index last week even as the S&P 500 continued to recover.
The chart below shows our P&C stock index (unfortunately, not yet available as an ETF) compared with the S&P 500 and the S&P 500 Financials index.
When we break the overall P&C index down by segment, we can clearly see which parts of the industry are driving growth and which are not.
The largest driver of growth comes from the personal lines industry, which has itself been driven by the huge market cap and significant 17% year-to-date share price growth of Progressive. Excluding Progressive gives a year-to-date market cap growth for the P&C industry of 3.8%, which has been held up by brokers, specialty insurers and large cap commercial carriers.
Regional insurers and reinsurers have lagged the pack in April and finished the month below where they started the year.
Regional losses were driven by Cincinnati Financial, by far the largest regional by market cap, and by Selective. Disappointing earnings results from Arch and RenaissanceRe, the latter primarily attributable to the catastrophe losses from the California wildfires, further depressed reinsurance stocks, which have been among the weakest segments this year.
The chart below shows these trends in detail from the start of the year.
Insurance’s future earnings remain below the S&P 500, but the gap is shrinking
At the start of the year, every P&C segment was trading at a significant discount compared to the S&P 500 on a price-to-earnings basis.
This was true for all of 2024 but starting in February and March, the S&P 500’s forward earnings multiples have declined, coinciding with the imposition of new tariffs.
The S&P 500’s price to forward earnings have now rebounded to just above some of the highest P&C segments at the end of April, also coinciding with President Trump walking back many of the tariffs announced on April 2.
These shifts have been driven both by changing earnings forecasts and stock movements on a company-by-company basis, without a clear trend of which side influences the ratio more.
Brokers and regionals are neck-and-neck with the S&P 500 and well above the rest of the insurance segments. Large commercials and reinsurers retain the lowest price to forward earnings expectations, which is unchanged from when we last made note of this metric back in January.
Notably, every segment has a higher price to forward earnings ratio now than it did on January 1, while the S&P 500’s has declined despite some fluctuations in April.
The chart below shows price to forward earnings, by segment, from the beginning of the year.
If short interest is used as a proxy, investor confidence in insurance stocks is holding up
Short interest as a percentage of float shows the percentage of a company’s floated shares that are currently held in short positions by investors. This can allow us to see, roughly, if the market expects a stock’s price to decline in the near term. It is only one piece of the puzzle, however, and may not give an accurate view of how investors view a stock in the longer term.
While there has been much tumult in the stock market as we’ve seen above, the average level of short interest in P&C securities has only increased by 0.2% when compared to January 1 of this year. This shows that investors’ outlook on the future direction of P&C stocks relative to the rest of the market is generally unchanged from the start of the year.
With that in mind, a few specific tickers have seen their short interest increase significantly. Mercury’s has shot up, owing to their major losses related to the California wildfires last quarter. ProAssurance has gone from a below-average level of short interest to the eighth highest among P&C insurers, likely reflecting a small chunk of investors betting against the completion of the sale to The Doctors Company.
The chart below shows the top 10 insurers by short interest, as well as the average for all P&C companies.